Immigrants from Romania vs White/Caucasian Disability
COMPARE
Immigrants from Romania
White/Caucasian
Disability
Disability Comparison
Immigrants from Romania
Whites/Caucasians
11.2%
DISABILITY
98.5/ 100
METRIC RATING
88th/ 347
METRIC RANK
13.0%
DISABILITY
0.0/ 100
METRIC RATING
288th/ 347
METRIC RANK
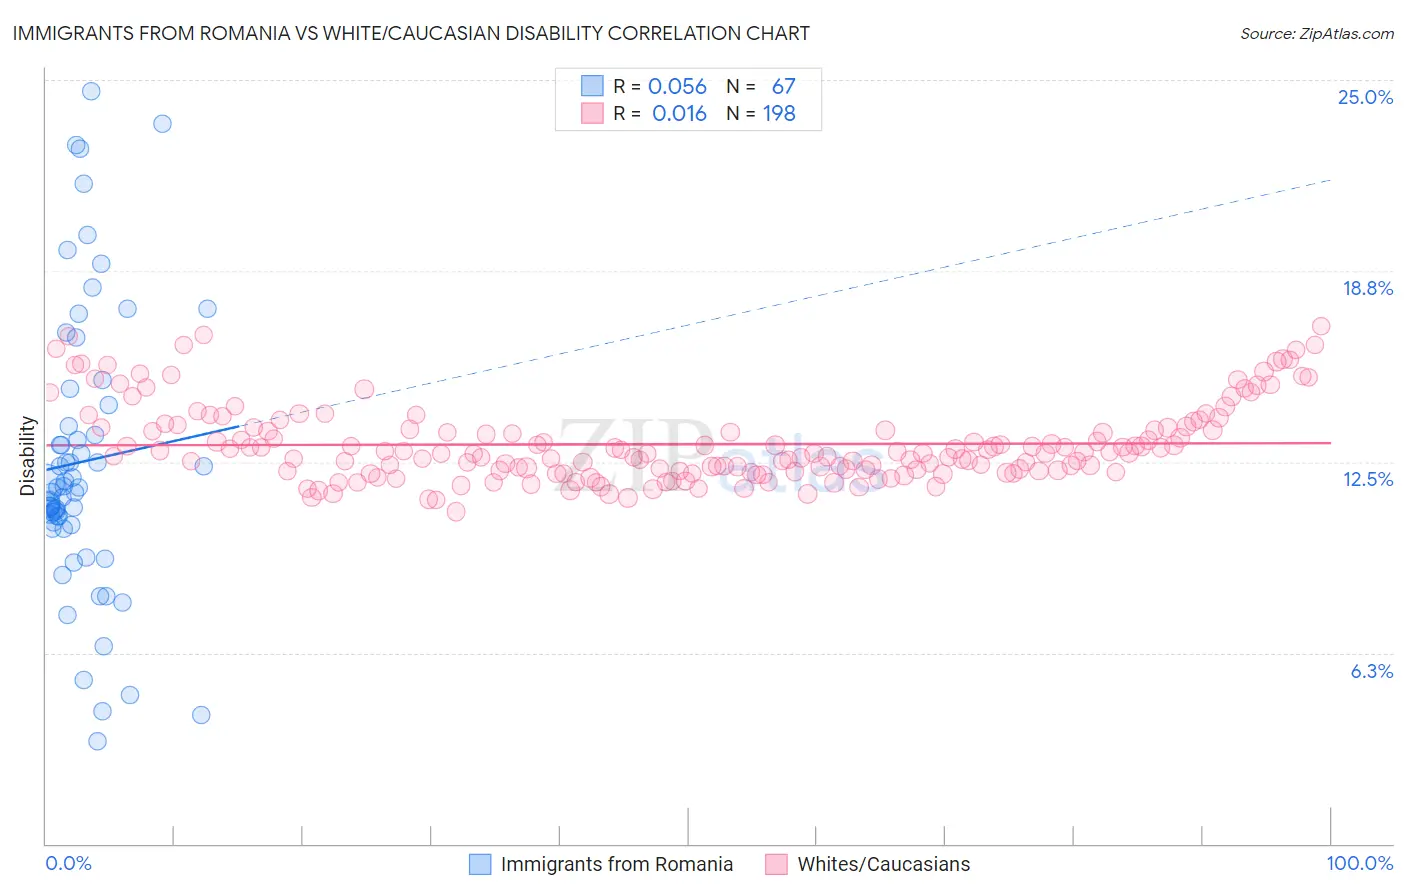
Immigrants from Romania vs White/Caucasian Disability Correlation Chart
The statistical analysis conducted on geographies consisting of 256,993,596 people shows a slight positive correlation between the proportion of Immigrants from Romania and percentage of population with a disability in the United States with a correlation coefficient (R) of 0.056 and weighted average of 11.2%. Similarly, the statistical analysis conducted on geographies consisting of 583,070,894 people shows no correlation between the proportion of Whites/Caucasians and percentage of population with a disability in the United States with a correlation coefficient (R) of 0.016 and weighted average of 13.0%, a difference of 16.7%.
Disability Correlation Summary
| Measurement | Immigrants from Romania | White/Caucasian |
| Minimum | 3.4% | 10.9% |
| Maximum | 24.6% | 16.9% |
| Range | 21.3% | 6.1% |
| Mean | 12.5% | 13.1% |
| Median | 11.6% | 12.8% |
| Interquartile 25% (IQ1) | 10.4% | 12.2% |
| Interquartile 75% (IQ3) | 14.4% | 13.6% |
| Interquartile Range (IQR) | 3.9% | 1.4% |
| Standard Deviation (Sample) | 4.6% | 1.3% |
| Standard Deviation (Population) | 4.6% | 1.3% |
Similar Demographics by Disability
Demographics Similar to Immigrants from Romania by Disability
In terms of disability, the demographic groups most similar to Immigrants from Romania are Immigrants from South Africa (11.2%, a difference of 0.25%), Palestinian (11.1%, a difference of 0.29%), Immigrants from Brazil (11.2%, a difference of 0.30%), Immigrants from Western Asia (11.2%, a difference of 0.32%), and Immigrants from Belarus (11.1%, a difference of 0.33%).
| Demographics | Rating | Rank | Disability |
| Immigrants | Poland | 99.1 /100 | #81 | Exceptional 11.1% |
| Chileans | 99.1 /100 | #82 | Exceptional 11.1% |
| Immigrants | Switzerland | 99.0 /100 | #83 | Exceptional 11.1% |
| Immigrants | Sierra Leone | 99.0 /100 | #84 | Exceptional 11.1% |
| Immigrants | Belarus | 98.9 /100 | #85 | Exceptional 11.1% |
| Immigrants | Russia | 98.9 /100 | #86 | Exceptional 11.1% |
| Palestinians | 98.9 /100 | #87 | Exceptional 11.1% |
| Immigrants | Romania | 98.5 /100 | #88 | Exceptional 11.2% |
| Immigrants | South Africa | 98.2 /100 | #89 | Exceptional 11.2% |
| Immigrants | Brazil | 98.1 /100 | #90 | Exceptional 11.2% |
| Immigrants | Western Asia | 98.1 /100 | #91 | Exceptional 11.2% |
| Ecuadorians | 98.0 /100 | #92 | Exceptional 11.2% |
| Immigrants | Ecuador | 98.0 /100 | #93 | Exceptional 11.2% |
| Immigrants | Morocco | 97.8 /100 | #94 | Exceptional 11.2% |
| Eastern Europeans | 97.8 /100 | #95 | Exceptional 11.2% |
Demographics Similar to Whites/Caucasians by Disability
In terms of disability, the demographic groups most similar to Whites/Caucasians are Slovak (13.0%, a difference of 0.0%), African (13.0%, a difference of 0.020%), Cheyenne (13.0%, a difference of 0.060%), Yaqui (13.1%, a difference of 0.29%), and English (13.0%, a difference of 0.43%).
| Demographics | Rating | Rank | Disability |
| Immigrants | Portugal | 0.0 /100 | #281 | Tragic 12.9% |
| Scottish | 0.0 /100 | #282 | Tragic 12.9% |
| Irish | 0.0 /100 | #283 | Tragic 12.9% |
| Welsh | 0.0 /100 | #284 | Tragic 12.9% |
| Crow | 0.0 /100 | #285 | Tragic 12.9% |
| English | 0.0 /100 | #286 | Tragic 13.0% |
| Africans | 0.0 /100 | #287 | Tragic 13.0% |
| Whites/Caucasians | 0.0 /100 | #288 | Tragic 13.0% |
| Slovaks | 0.0 /100 | #289 | Tragic 13.0% |
| Cheyenne | 0.0 /100 | #290 | Tragic 13.0% |
| Yaqui | 0.0 /100 | #291 | Tragic 13.1% |
| Aleuts | 0.0 /100 | #292 | Tragic 13.1% |
| Marshallese | 0.0 /100 | #293 | Tragic 13.1% |
| Celtics | 0.0 /100 | #294 | Tragic 13.1% |
| Immigrants | Nonimmigrants | 0.0 /100 | #295 | Tragic 13.2% |