Immigrants from Russia vs Immigrants Disability
COMPARE
Immigrants from Russia
Immigrants
Disability
Disability Comparison
Immigrants from Russia
Immigrants
11.1%
DISABILITY
98.9/ 100
METRIC RATING
86th/ 347
METRIC RANK
11.3%
DISABILITY
96.4/ 100
METRIC RATING
104th/ 347
METRIC RANK
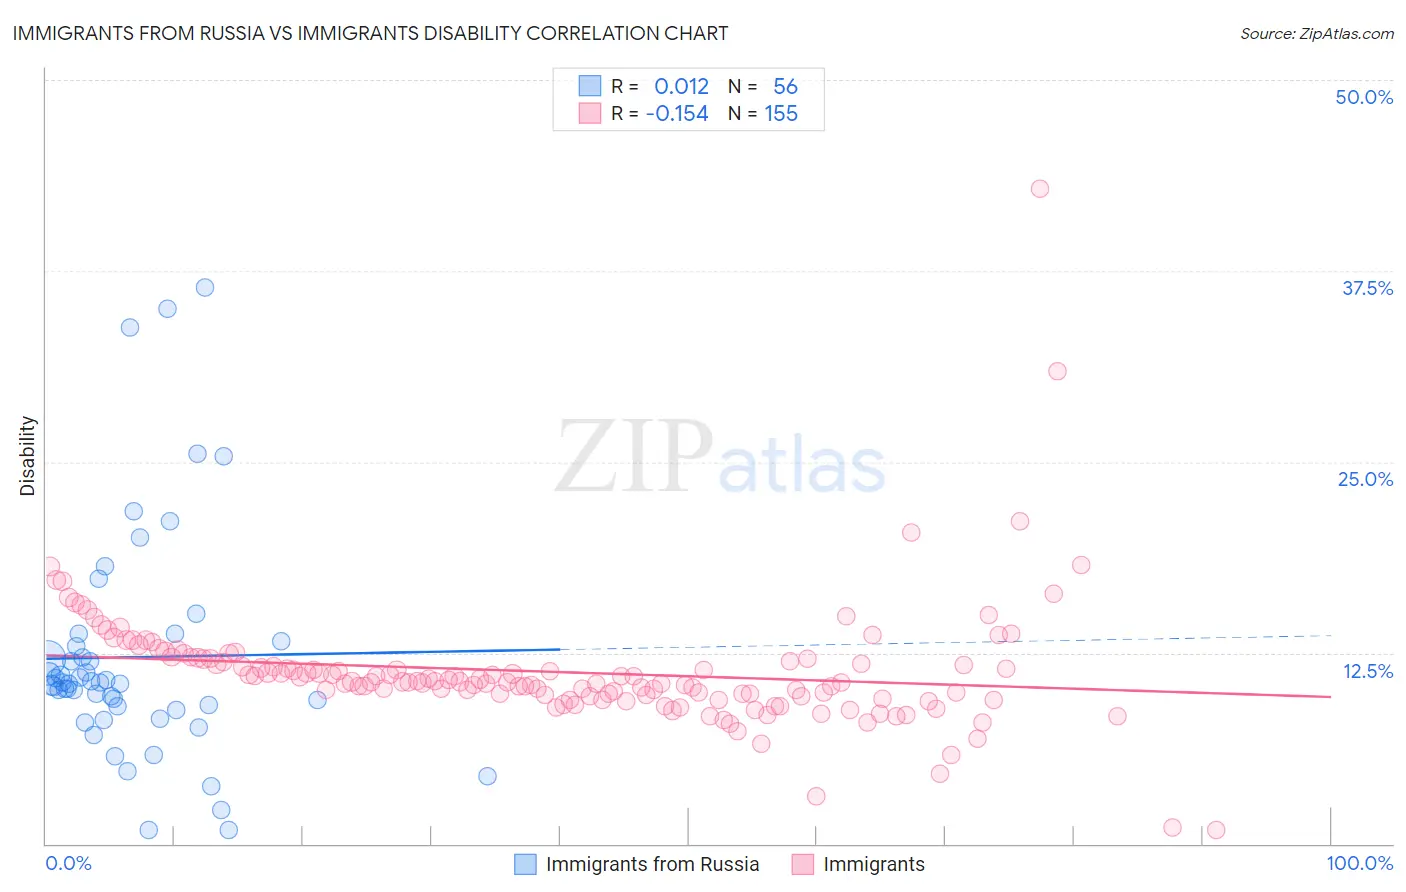
Immigrants from Russia vs Immigrants Disability Correlation Chart
The statistical analysis conducted on geographies consisting of 347,926,154 people shows no correlation between the proportion of Immigrants from Russia and percentage of population with a disability in the United States with a correlation coefficient (R) of 0.012 and weighted average of 11.1%. Similarly, the statistical analysis conducted on geographies consisting of 577,602,832 people shows a poor negative correlation between the proportion of Immigrants and percentage of population with a disability in the United States with a correlation coefficient (R) of -0.154 and weighted average of 11.3%, a difference of 1.4%.
Disability Correlation Summary
| Measurement | Immigrants from Russia | Immigrants |
| Minimum | 0.87% | 0.89% |
| Maximum | 36.4% | 42.9% |
| Range | 35.5% | 42.0% |
| Mean | 12.2% | 11.3% |
| Median | 10.5% | 10.6% |
| Interquartile 25% (IQ1) | 8.9% | 9.7% |
| Interquartile 75% (IQ3) | 13.1% | 12.1% |
| Interquartile Range (IQR) | 4.2% | 2.4% |
| Standard Deviation (Sample) | 7.5% | 4.1% |
| Standard Deviation (Population) | 7.4% | 4.1% |
Demographics Similar to Immigrants from Russia and Immigrants by Disability
In terms of disability, the demographic groups most similar to Immigrants from Russia are Immigrants from Belarus (11.1%, a difference of 0.0%), Palestinian (11.1%, a difference of 0.040%), Immigrants from Romania (11.2%, a difference of 0.33%), Immigrants from South Africa (11.2%, a difference of 0.58%), and Immigrants from Brazil (11.2%, a difference of 0.63%). Similarly, the demographic groups most similar to Immigrants are Immigrants from Uruguay (11.3%, a difference of 0.010%), Immigrants from Kazakhstan (11.3%, a difference of 0.010%), Immigrants from Eastern Africa (11.3%, a difference of 0.080%), Immigrants from Nicaragua (11.3%, a difference of 0.14%), and Immigrants from Greece (11.3%, a difference of 0.19%).
| Demographics | Rating | Rank | Disability |
| Immigrants | Belarus | 98.9 /100 | #85 | Exceptional 11.1% |
| Immigrants | Russia | 98.9 /100 | #86 | Exceptional 11.1% |
| Palestinians | 98.9 /100 | #87 | Exceptional 11.1% |
| Immigrants | Romania | 98.5 /100 | #88 | Exceptional 11.2% |
| Immigrants | South Africa | 98.2 /100 | #89 | Exceptional 11.2% |
| Immigrants | Brazil | 98.1 /100 | #90 | Exceptional 11.2% |
| Immigrants | Western Asia | 98.1 /100 | #91 | Exceptional 11.2% |
| Ecuadorians | 98.0 /100 | #92 | Exceptional 11.2% |
| Immigrants | Ecuador | 98.0 /100 | #93 | Exceptional 11.2% |
| Immigrants | Morocco | 97.8 /100 | #94 | Exceptional 11.2% |
| Eastern Europeans | 97.8 /100 | #95 | Exceptional 11.2% |
| Immigrants | Zimbabwe | 97.7 /100 | #96 | Exceptional 11.2% |
| Bhutanese | 97.4 /100 | #97 | Exceptional 11.2% |
| Uruguayans | 97.4 /100 | #98 | Exceptional 11.2% |
| Immigrants | Czechoslovakia | 97.4 /100 | #99 | Exceptional 11.2% |
| Immigrants | Greece | 96.9 /100 | #100 | Exceptional 11.3% |
| Immigrants | Nicaragua | 96.8 /100 | #101 | Exceptional 11.3% |
| Immigrants | Eastern Africa | 96.7 /100 | #102 | Exceptional 11.3% |
| Immigrants | Uruguay | 96.4 /100 | #103 | Exceptional 11.3% |
| Immigrants | Immigrants | 96.4 /100 | #104 | Exceptional 11.3% |
| Immigrants | Kazakhstan | 96.4 /100 | #105 | Exceptional 11.3% |