Immigrants from Romania vs Trinidadian and Tobagonian Disability
COMPARE
Immigrants from Romania
Trinidadian and Tobagonian
Disability
Disability Comparison
Immigrants from Romania
Trinidadians and Tobagonians
11.2%
DISABILITY
98.5/ 100
METRIC RATING
88th/ 347
METRIC RANK
11.7%
DISABILITY
52.7/ 100
METRIC RATING
172nd/ 347
METRIC RANK
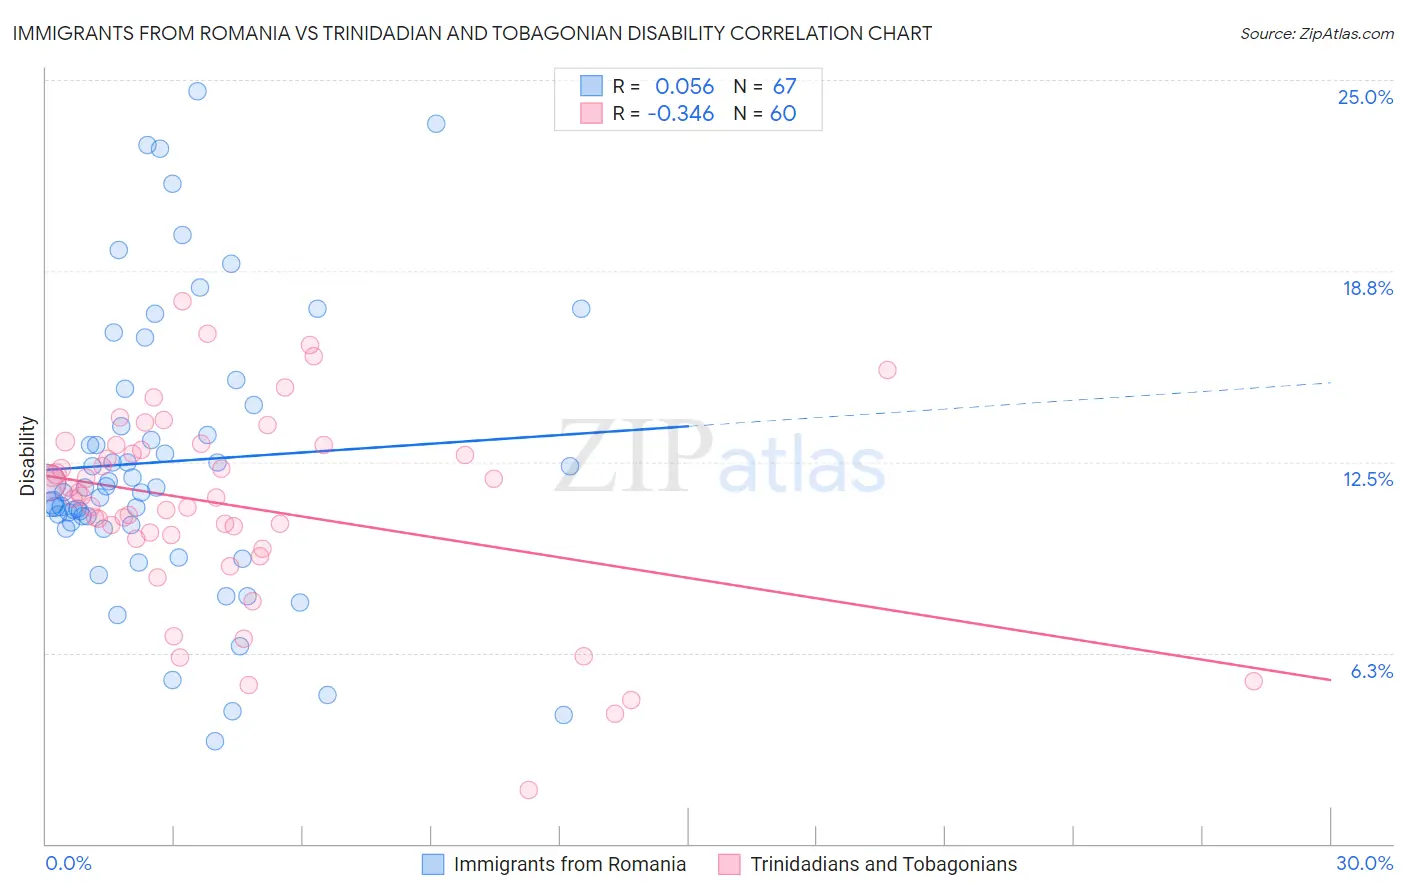
Immigrants from Romania vs Trinidadian and Tobagonian Disability Correlation Chart
The statistical analysis conducted on geographies consisting of 256,993,596 people shows a slight positive correlation between the proportion of Immigrants from Romania and percentage of population with a disability in the United States with a correlation coefficient (R) of 0.056 and weighted average of 11.2%. Similarly, the statistical analysis conducted on geographies consisting of 219,849,540 people shows a mild negative correlation between the proportion of Trinidadians and Tobagonians and percentage of population with a disability in the United States with a correlation coefficient (R) of -0.346 and weighted average of 11.7%, a difference of 4.8%.
Disability Correlation Summary
| Measurement | Immigrants from Romania | Trinidadian and Tobagonian |
| Minimum | 3.4% | 1.7% |
| Maximum | 24.6% | 17.7% |
| Range | 21.3% | 16.0% |
| Mean | 12.5% | 11.1% |
| Median | 11.6% | 11.4% |
| Interquartile 25% (IQ1) | 10.4% | 10.0% |
| Interquartile 75% (IQ3) | 14.4% | 13.0% |
| Interquartile Range (IQR) | 3.9% | 2.9% |
| Standard Deviation (Sample) | 4.6% | 3.2% |
| Standard Deviation (Population) | 4.6% | 3.2% |
Similar Demographics by Disability
Demographics Similar to Immigrants from Romania by Disability
In terms of disability, the demographic groups most similar to Immigrants from Romania are Immigrants from South Africa (11.2%, a difference of 0.25%), Palestinian (11.1%, a difference of 0.29%), Immigrants from Brazil (11.2%, a difference of 0.30%), Immigrants from Western Asia (11.2%, a difference of 0.32%), and Immigrants from Belarus (11.1%, a difference of 0.33%).
| Demographics | Rating | Rank | Disability |
| Immigrants | Poland | 99.1 /100 | #81 | Exceptional 11.1% |
| Chileans | 99.1 /100 | #82 | Exceptional 11.1% |
| Immigrants | Switzerland | 99.0 /100 | #83 | Exceptional 11.1% |
| Immigrants | Sierra Leone | 99.0 /100 | #84 | Exceptional 11.1% |
| Immigrants | Belarus | 98.9 /100 | #85 | Exceptional 11.1% |
| Immigrants | Russia | 98.9 /100 | #86 | Exceptional 11.1% |
| Palestinians | 98.9 /100 | #87 | Exceptional 11.1% |
| Immigrants | Romania | 98.5 /100 | #88 | Exceptional 11.2% |
| Immigrants | South Africa | 98.2 /100 | #89 | Exceptional 11.2% |
| Immigrants | Brazil | 98.1 /100 | #90 | Exceptional 11.2% |
| Immigrants | Western Asia | 98.1 /100 | #91 | Exceptional 11.2% |
| Ecuadorians | 98.0 /100 | #92 | Exceptional 11.2% |
| Immigrants | Ecuador | 98.0 /100 | #93 | Exceptional 11.2% |
| Immigrants | Morocco | 97.8 /100 | #94 | Exceptional 11.2% |
| Eastern Europeans | 97.8 /100 | #95 | Exceptional 11.2% |
Demographics Similar to Trinidadians and Tobagonians by Disability
In terms of disability, the demographic groups most similar to Trinidadians and Tobagonians are Immigrants from Albania (11.7%, a difference of 0.010%), Immigrants from Southern Europe (11.7%, a difference of 0.010%), Immigrants from Austria (11.7%, a difference of 0.030%), Immigrants from Latin America (11.7%, a difference of 0.060%), and Estonian (11.7%, a difference of 0.080%).
| Demographics | Rating | Rank | Disability |
| Cubans | 56.7 /100 | #165 | Average 11.7% |
| Pakistanis | 54.7 /100 | #166 | Average 11.7% |
| Estonians | 54.4 /100 | #167 | Average 11.7% |
| Immigrants | Latin America | 54.1 /100 | #168 | Average 11.7% |
| Immigrants | Austria | 53.4 /100 | #169 | Average 11.7% |
| Immigrants | Albania | 52.8 /100 | #170 | Average 11.7% |
| Immigrants | Southern Europe | 52.8 /100 | #171 | Average 11.7% |
| Trinidadians and Tobagonians | 52.7 /100 | #172 | Average 11.7% |
| Maltese | 50.6 /100 | #173 | Average 11.7% |
| Albanians | 50.0 /100 | #174 | Average 11.7% |
| Haitians | 48.6 /100 | #175 | Average 11.7% |
| Immigrants | Western Africa | 47.5 /100 | #176 | Average 11.7% |
| Immigrants | Central America | 46.6 /100 | #177 | Average 11.7% |
| Greeks | 46.2 /100 | #178 | Average 11.7% |
| Immigrants | Armenia | 41.9 /100 | #179 | Average 11.7% |