Immigrants from Romania vs Somali Male Disability
COMPARE
Immigrants from Romania
Somali
Male Disability
Male Disability Comparison
Immigrants from Romania
Somalis
10.7%
MALE DISABILITY
96.5/ 100
METRIC RATING
98th/ 347
METRIC RANK
11.4%
MALE DISABILITY
18.2/ 100
METRIC RATING
197th/ 347
METRIC RANK
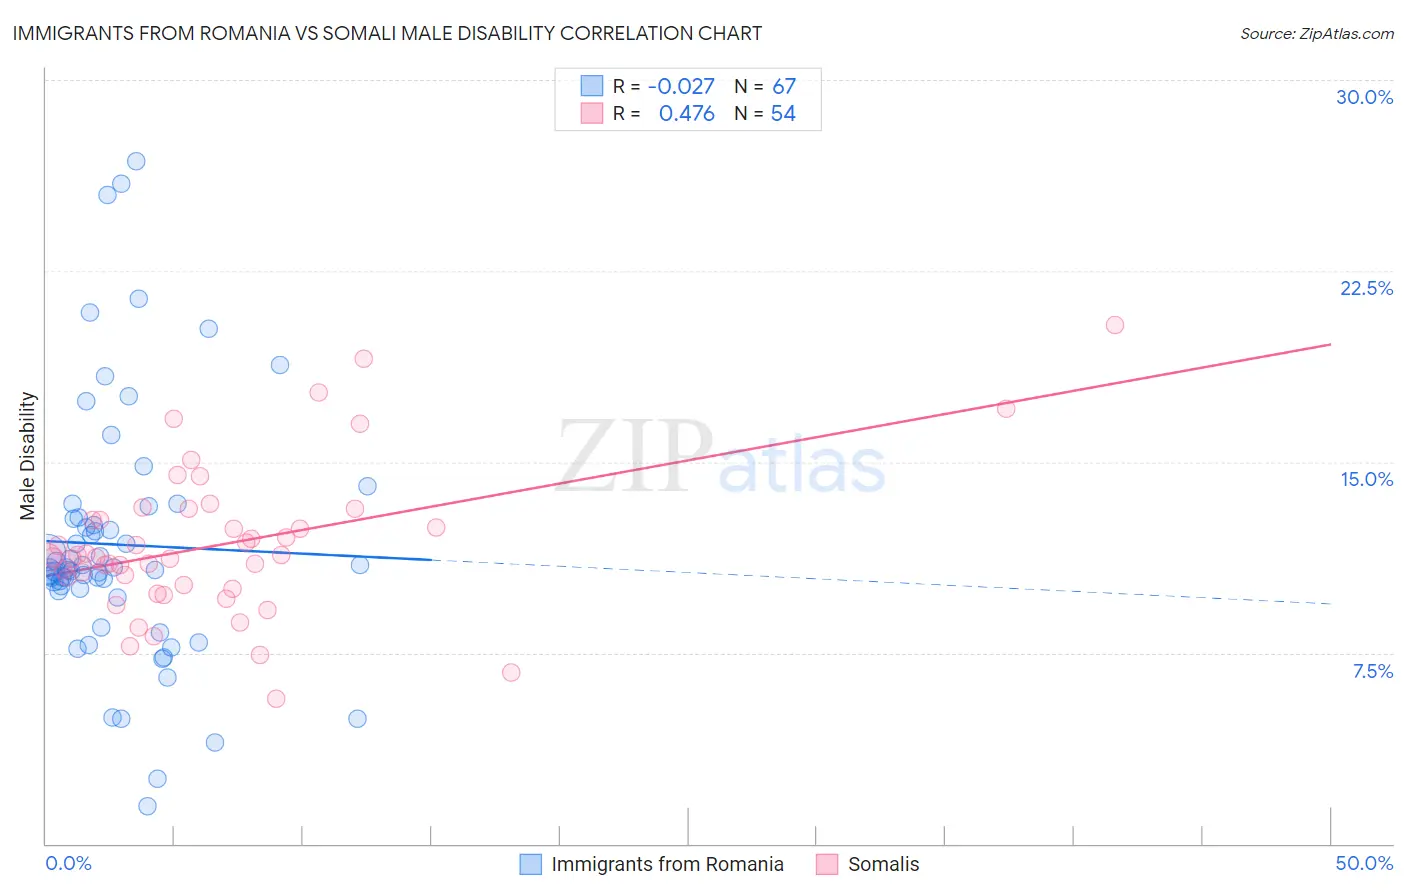
Immigrants from Romania vs Somali Male Disability Correlation Chart
The statistical analysis conducted on geographies consisting of 256,982,377 people shows no correlation between the proportion of Immigrants from Romania and percentage of males with a disability in the United States with a correlation coefficient (R) of -0.027 and weighted average of 10.7%. Similarly, the statistical analysis conducted on geographies consisting of 99,314,989 people shows a moderate positive correlation between the proportion of Somalis and percentage of males with a disability in the United States with a correlation coefficient (R) of 0.476 and weighted average of 11.4%, a difference of 7.0%.
Male Disability Correlation Summary
| Measurement | Immigrants from Romania | Somali |
| Minimum | 1.5% | 5.7% |
| Maximum | 26.8% | 20.4% |
| Range | 25.3% | 14.6% |
| Mean | 11.7% | 11.8% |
| Median | 10.7% | 11.2% |
| Interquartile 25% (IQ1) | 9.9% | 10.1% |
| Interquartile 75% (IQ3) | 12.8% | 12.7% |
| Interquartile Range (IQR) | 2.9% | 2.6% |
| Standard Deviation (Sample) | 5.0% | 2.9% |
| Standard Deviation (Population) | 5.0% | 2.9% |
Similar Demographics by Male Disability
Demographics Similar to Immigrants from Romania by Male Disability
In terms of male disability, the demographic groups most similar to Immigrants from Romania are Immigrants from Armenia (10.7%, a difference of 0.060%), Nicaraguan (10.7%, a difference of 0.080%), Immigrants from Switzerland (10.7%, a difference of 0.14%), Chilean (10.7%, a difference of 0.18%), and Immigrants from Sweden (10.7%, a difference of 0.21%).
| Demographics | Rating | Rank | Male Disability |
| Immigrants | France | 97.6 /100 | #91 | Exceptional 10.6% |
| Palestinians | 97.4 /100 | #92 | Exceptional 10.7% |
| Immigrants | St. Vincent and the Grenadines | 97.1 /100 | #93 | Exceptional 10.7% |
| Immigrants | Sweden | 96.9 /100 | #94 | Exceptional 10.7% |
| Chileans | 96.9 /100 | #95 | Exceptional 10.7% |
| Nicaraguans | 96.6 /100 | #96 | Exceptional 10.7% |
| Immigrants | Armenia | 96.6 /100 | #97 | Exceptional 10.7% |
| Immigrants | Romania | 96.5 /100 | #98 | Exceptional 10.7% |
| Immigrants | Switzerland | 96.1 /100 | #99 | Exceptional 10.7% |
| Immigrants | Kazakhstan | 95.9 /100 | #100 | Exceptional 10.7% |
| Immigrants | Greece | 95.6 /100 | #101 | Exceptional 10.7% |
| Immigrants | Eastern Europe | 95.3 /100 | #102 | Exceptional 10.7% |
| Uruguayans | 95.3 /100 | #103 | Exceptional 10.7% |
| Immigrants | Nigeria | 95.1 /100 | #104 | Exceptional 10.8% |
| Immigrants | Brazil | 95.0 /100 | #105 | Exceptional 10.8% |
Demographics Similar to Somalis by Male Disability
In terms of male disability, the demographic groups most similar to Somalis are West Indian (11.4%, a difference of 0.020%), Immigrants from Jamaica (11.5%, a difference of 0.18%), Immigrants from Oceania (11.4%, a difference of 0.23%), Belizean (11.4%, a difference of 0.26%), and Lebanese (11.5%, a difference of 0.27%).
| Demographics | Rating | Rank | Male Disability |
| Immigrants | Bosnia and Herzegovina | 25.4 /100 | #190 | Fair 11.4% |
| Senegalese | 23.2 /100 | #191 | Fair 11.4% |
| Assyrians/Chaldeans/Syriacs | 23.2 /100 | #192 | Fair 11.4% |
| Greeks | 22.2 /100 | #193 | Fair 11.4% |
| Belizeans | 21.2 /100 | #194 | Fair 11.4% |
| Immigrants | Oceania | 20.9 /100 | #195 | Fair 11.4% |
| West Indians | 18.4 /100 | #196 | Poor 11.4% |
| Somalis | 18.2 /100 | #197 | Poor 11.4% |
| Immigrants | Jamaica | 16.3 /100 | #198 | Poor 11.5% |
| Lebanese | 15.4 /100 | #199 | Poor 11.5% |
| Immigrants | Iraq | 13.0 /100 | #200 | Poor 11.5% |
| Immigrants | Panama | 13.0 /100 | #201 | Poor 11.5% |
| Immigrants | Mexico | 12.6 /100 | #202 | Poor 11.5% |
| Jamaicans | 10.9 /100 | #203 | Poor 11.5% |
| Immigrants | Cambodia | 10.8 /100 | #204 | Poor 11.5% |