Basque vs Immigrants from Hungary Disability Age 5 to 17
COMPARE
Basque
Immigrants from Hungary
Disability Age 5 to 17
Disability Age 5 to 17 Comparison
Basques
Immigrants from Hungary
5.7%
DISABILITY AGE 5 TO 17
13.7/ 100
METRIC RATING
201st/ 347
METRIC RANK
5.5%
DISABILITY AGE 5 TO 17
87.9/ 100
METRIC RATING
143rd/ 347
METRIC RANK
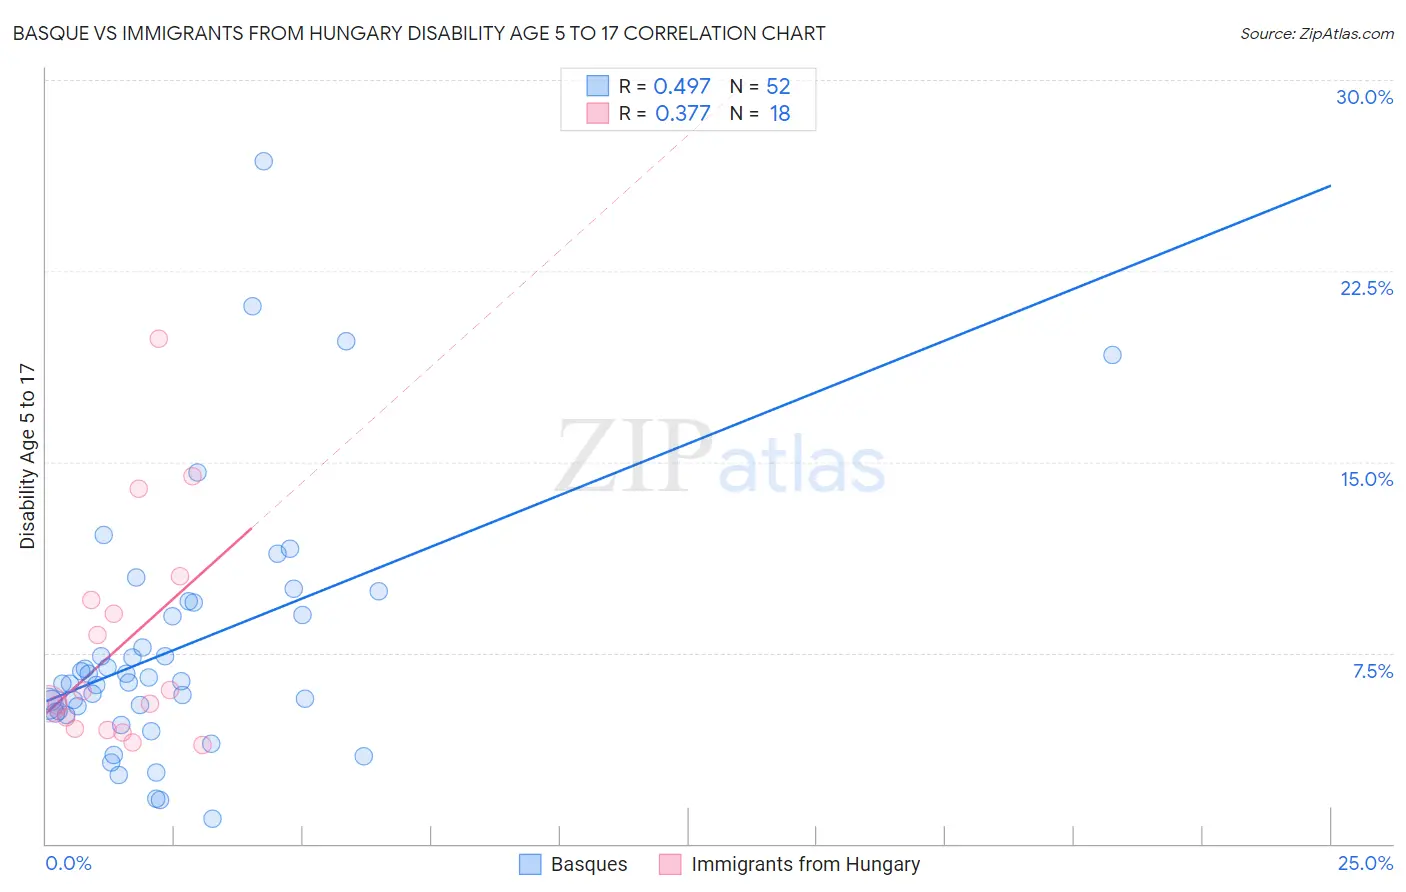
Basque vs Immigrants from Hungary Disability Age 5 to 17 Correlation Chart
The statistical analysis conducted on geographies consisting of 165,145,807 people shows a moderate positive correlation between the proportion of Basques and percentage of population with a disability between the ages 5 and 17 in the United States with a correlation coefficient (R) of 0.497 and weighted average of 5.7%. Similarly, the statistical analysis conducted on geographies consisting of 194,505,610 people shows a mild positive correlation between the proportion of Immigrants from Hungary and percentage of population with a disability between the ages 5 and 17 in the United States with a correlation coefficient (R) of 0.377 and weighted average of 5.5%, a difference of 4.8%.
Disability Age 5 to 17 Correlation Summary
| Measurement | Basque | Immigrants from Hungary |
| Minimum | 0.97% | 3.9% |
| Maximum | 26.8% | 19.9% |
| Range | 25.9% | 16.0% |
| Mean | 7.7% | 7.8% |
| Median | 6.4% | 5.7% |
| Interquartile 25% (IQ1) | 5.2% | 4.5% |
| Interquartile 75% (IQ3) | 9.2% | 9.6% |
| Interquartile Range (IQR) | 4.0% | 5.1% |
| Standard Deviation (Sample) | 5.0% | 4.4% |
| Standard Deviation (Population) | 4.9% | 4.3% |
Similar Demographics by Disability Age 5 to 17
Demographics Similar to Basques by Disability Age 5 to 17
In terms of disability age 5 to 17, the demographic groups most similar to Basques are Austrian (5.7%, a difference of 0.050%), Icelander (5.7%, a difference of 0.090%), Spanish American Indian (5.7%, a difference of 0.090%), Northern European (5.7%, a difference of 0.15%), and Paiute (5.7%, a difference of 0.27%).
| Demographics | Rating | Rank | Disability Age 5 to 17 |
| Croatians | 23.6 /100 | #194 | Fair 5.7% |
| Immigrants | Nigeria | 23.4 /100 | #195 | Fair 5.7% |
| Inupiat | 23.3 /100 | #196 | Fair 5.7% |
| Immigrants | North America | 23.1 /100 | #197 | Fair 5.7% |
| Norwegians | 20.9 /100 | #198 | Fair 5.7% |
| Northern Europeans | 15.2 /100 | #199 | Poor 5.7% |
| Icelanders | 14.6 /100 | #200 | Poor 5.7% |
| Basques | 13.7 /100 | #201 | Poor 5.7% |
| Austrians | 13.2 /100 | #202 | Poor 5.7% |
| Spanish American Indians | 12.8 /100 | #203 | Poor 5.7% |
| Paiute | 11.2 /100 | #204 | Poor 5.7% |
| Trinidadians and Tobagonians | 10.8 /100 | #205 | Poor 5.7% |
| Immigrants | Africa | 10.8 /100 | #206 | Poor 5.7% |
| Moroccans | 10.4 /100 | #207 | Poor 5.7% |
| Kenyans | 10.0 /100 | #208 | Poor 5.8% |
Demographics Similar to Immigrants from Hungary by Disability Age 5 to 17
In terms of disability age 5 to 17, the demographic groups most similar to Immigrants from Hungary are Colombian (5.5%, a difference of 0.020%), Pakistani (5.5%, a difference of 0.070%), Immigrants from Guatemala (5.5%, a difference of 0.14%), South American Indian (5.5%, a difference of 0.17%), and Immigrants from Netherlands (5.4%, a difference of 0.34%).
| Demographics | Rating | Rank | Disability Age 5 to 17 |
| Immigrants | Denmark | 91.4 /100 | #136 | Exceptional 5.4% |
| Navajo | 90.9 /100 | #137 | Exceptional 5.4% |
| Immigrants | Oceania | 90.8 /100 | #138 | Exceptional 5.4% |
| Belizeans | 90.8 /100 | #139 | Exceptional 5.4% |
| Immigrants | Netherlands | 90.5 /100 | #140 | Exceptional 5.4% |
| South American Indians | 89.3 /100 | #141 | Excellent 5.5% |
| Colombians | 88.0 /100 | #142 | Excellent 5.5% |
| Immigrants | Hungary | 87.9 /100 | #143 | Excellent 5.5% |
| Pakistanis | 87.3 /100 | #144 | Excellent 5.5% |
| Immigrants | Guatemala | 86.6 /100 | #145 | Excellent 5.5% |
| Albanians | 83.7 /100 | #146 | Excellent 5.5% |
| Immigrants | Albania | 83.1 /100 | #147 | Excellent 5.5% |
| Samoans | 81.9 /100 | #148 | Excellent 5.5% |
| Central Americans | 81.6 /100 | #149 | Excellent 5.5% |
| Guatemalans | 81.5 /100 | #150 | Excellent 5.5% |