Immigrants vs Immigrants from Hungary Disability Age 5 to 17
COMPARE
Immigrants
Immigrants from Hungary
Disability Age 5 to 17
Disability Age 5 to 17 Comparison
Immigrants
Immigrants from Hungary
5.4%
DISABILITY AGE 5 TO 17
97.0/ 100
METRIC RATING
120th/ 347
METRIC RANK
5.5%
DISABILITY AGE 5 TO 17
87.9/ 100
METRIC RATING
143rd/ 347
METRIC RANK
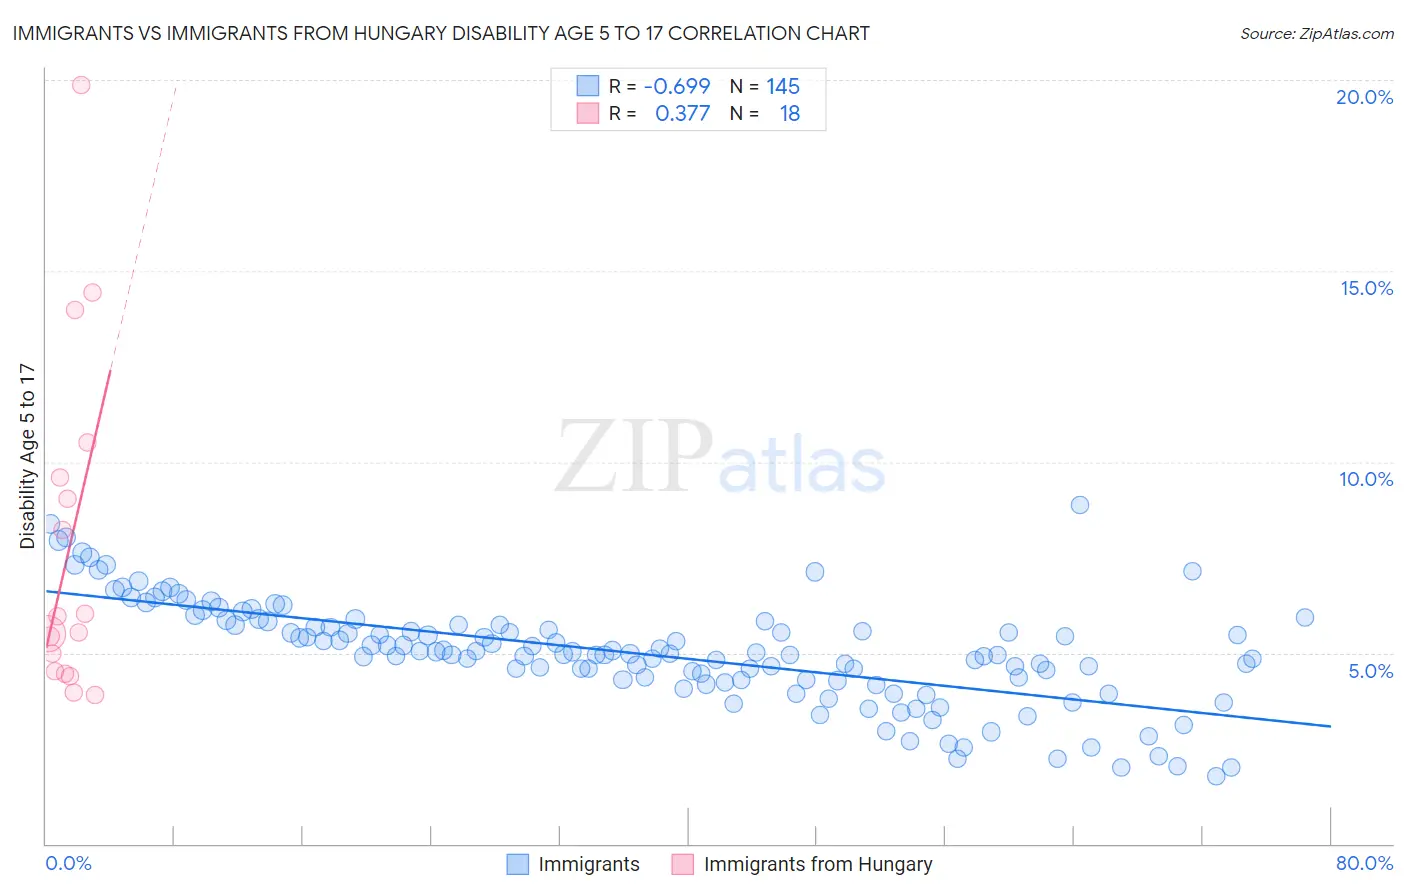
Immigrants vs Immigrants from Hungary Disability Age 5 to 17 Correlation Chart
The statistical analysis conducted on geographies consisting of 563,154,251 people shows a significant negative correlation between the proportion of Immigrants and percentage of population with a disability between the ages 5 and 17 in the United States with a correlation coefficient (R) of -0.699 and weighted average of 5.4%. Similarly, the statistical analysis conducted on geographies consisting of 194,505,610 people shows a mild positive correlation between the proportion of Immigrants from Hungary and percentage of population with a disability between the ages 5 and 17 in the United States with a correlation coefficient (R) of 0.377 and weighted average of 5.5%, a difference of 1.9%.
Disability Age 5 to 17 Correlation Summary
| Measurement | Immigrants | Immigrants from Hungary |
| Minimum | 1.8% | 3.9% |
| Maximum | 8.9% | 19.9% |
| Range | 7.1% | 16.0% |
| Mean | 5.0% | 7.8% |
| Median | 5.0% | 5.7% |
| Interquartile 25% (IQ1) | 4.3% | 4.5% |
| Interquartile 75% (IQ3) | 5.7% | 9.6% |
| Interquartile Range (IQR) | 1.4% | 5.1% |
| Standard Deviation (Sample) | 1.4% | 4.4% |
| Standard Deviation (Population) | 1.4% | 4.3% |
Similar Demographics by Disability Age 5 to 17
Demographics Similar to Immigrants by Disability Age 5 to 17
In terms of disability age 5 to 17, the demographic groups most similar to Immigrants are Immigrants from South America (5.4%, a difference of 0.050%), South American (5.4%, a difference of 0.060%), Immigrants from Afghanistan (5.3%, a difference of 0.17%), Cypriot (5.3%, a difference of 0.33%), and Maltese (5.4%, a difference of 0.38%).
| Demographics | Rating | Rank | Disability Age 5 to 17 |
| Aleuts | 97.8 /100 | #113 | Exceptional 5.3% |
| Immigrants | Northern Europe | 97.8 /100 | #114 | Exceptional 5.3% |
| Cubans | 97.8 /100 | #115 | Exceptional 5.3% |
| Cypriots | 97.7 /100 | #116 | Exceptional 5.3% |
| Immigrants | Afghanistan | 97.4 /100 | #117 | Exceptional 5.3% |
| South Americans | 97.1 /100 | #118 | Exceptional 5.4% |
| Immigrants | South America | 97.1 /100 | #119 | Exceptional 5.4% |
| Immigrants | Immigrants | 97.0 /100 | #120 | Exceptional 5.4% |
| Maltese | 96.0 /100 | #121 | Exceptional 5.4% |
| Chileans | 95.8 /100 | #122 | Exceptional 5.4% |
| Immigrants | Ethiopia | 95.5 /100 | #123 | Exceptional 5.4% |
| Crow | 95.0 /100 | #124 | Exceptional 5.4% |
| Immigrants | Chile | 95.0 /100 | #125 | Exceptional 5.4% |
| New Zealanders | 95.0 /100 | #126 | Exceptional 5.4% |
| Latvians | 95.0 /100 | #127 | Exceptional 5.4% |
Demographics Similar to Immigrants from Hungary by Disability Age 5 to 17
In terms of disability age 5 to 17, the demographic groups most similar to Immigrants from Hungary are Colombian (5.5%, a difference of 0.020%), Pakistani (5.5%, a difference of 0.070%), Immigrants from Guatemala (5.5%, a difference of 0.14%), South American Indian (5.5%, a difference of 0.17%), and Immigrants from Netherlands (5.4%, a difference of 0.34%).
| Demographics | Rating | Rank | Disability Age 5 to 17 |
| Immigrants | Denmark | 91.4 /100 | #136 | Exceptional 5.4% |
| Navajo | 90.9 /100 | #137 | Exceptional 5.4% |
| Immigrants | Oceania | 90.8 /100 | #138 | Exceptional 5.4% |
| Belizeans | 90.8 /100 | #139 | Exceptional 5.4% |
| Immigrants | Netherlands | 90.5 /100 | #140 | Exceptional 5.4% |
| South American Indians | 89.3 /100 | #141 | Excellent 5.5% |
| Colombians | 88.0 /100 | #142 | Excellent 5.5% |
| Immigrants | Hungary | 87.9 /100 | #143 | Excellent 5.5% |
| Pakistanis | 87.3 /100 | #144 | Excellent 5.5% |
| Immigrants | Guatemala | 86.6 /100 | #145 | Excellent 5.5% |
| Albanians | 83.7 /100 | #146 | Excellent 5.5% |
| Immigrants | Albania | 83.1 /100 | #147 | Excellent 5.5% |
| Samoans | 81.9 /100 | #148 | Excellent 5.5% |
| Central Americans | 81.6 /100 | #149 | Excellent 5.5% |
| Guatemalans | 81.5 /100 | #150 | Excellent 5.5% |