Immigrants from Moldova vs Immigrants from Hungary Male Disability
COMPARE
Immigrants from Moldova
Immigrants from Hungary
Male Disability
Male Disability Comparison
Immigrants from Moldova
Immigrants from Hungary
11.1%
MALE DISABILITY
72.8/ 100
METRIC RATING
154th/ 347
METRIC RANK
11.1%
MALE DISABILITY
61.2/ 100
METRIC RATING
166th/ 347
METRIC RANK
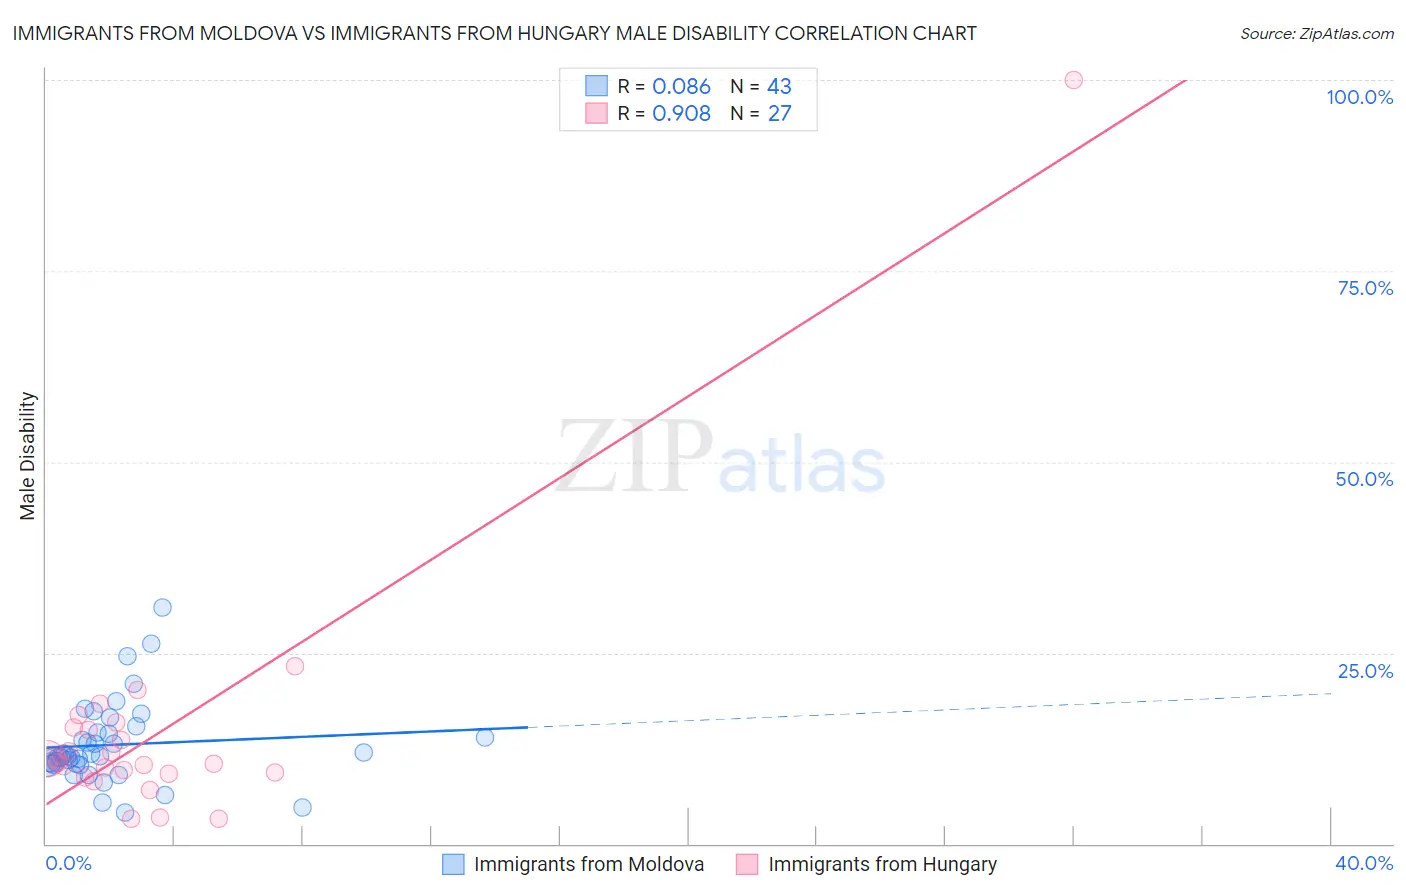
Immigrants from Moldova vs Immigrants from Hungary Male Disability Correlation Chart
The statistical analysis conducted on geographies consisting of 124,384,403 people shows a slight positive correlation between the proportion of Immigrants from Moldova and percentage of males with a disability in the United States with a correlation coefficient (R) of 0.086 and weighted average of 11.1%. Similarly, the statistical analysis conducted on geographies consisting of 195,705,126 people shows a near-perfect positive correlation between the proportion of Immigrants from Hungary and percentage of males with a disability in the United States with a correlation coefficient (R) of 0.908 and weighted average of 11.1%, a difference of 0.75%.
Male Disability Correlation Summary
| Measurement | Immigrants from Moldova | Immigrants from Hungary |
| Minimum | 4.1% | 3.2% |
| Maximum | 31.0% | 100.0% |
| Range | 26.8% | 96.8% |
| Mean | 13.0% | 14.7% |
| Median | 11.5% | 10.7% |
| Interquartile 25% (IQ1) | 10.5% | 9.1% |
| Interquartile 75% (IQ3) | 14.6% | 15.3% |
| Interquartile Range (IQR) | 4.1% | 6.1% |
| Standard Deviation (Sample) | 5.3% | 17.7% |
| Standard Deviation (Population) | 5.3% | 17.4% |
Demographics Similar to Immigrants from Moldova and Immigrants from Hungary by Male Disability
In terms of male disability, the demographic groups most similar to Immigrants from Moldova are Immigrants from Northern Europe (11.1%, a difference of 0.020%), Immigrants from Albania (11.0%, a difference of 0.11%), Immigrants from Middle Africa (11.1%, a difference of 0.14%), Cuban (11.0%, a difference of 0.15%), and Immigrants from Guatemala (11.0%, a difference of 0.17%). Similarly, the demographic groups most similar to Immigrants from Hungary are Luxembourger (11.1%, a difference of 0.040%), British West Indian (11.1%, a difference of 0.090%), Immigrants from Kenya (11.1%, a difference of 0.15%), Immigrants from Haiti (11.1%, a difference of 0.25%), and Immigrants from West Indies (11.1%, a difference of 0.27%).
| Demographics | Rating | Rank | Male Disability |
| Immigrants | Guatemala | 75.1 /100 | #150 | Good 11.0% |
| Cubans | 74.9 /100 | #151 | Good 11.0% |
| Immigrants | Albania | 74.4 /100 | #152 | Good 11.0% |
| Immigrants | Northern Europe | 73.2 /100 | #153 | Good 11.1% |
| Immigrants | Moldova | 72.8 /100 | #154 | Good 11.1% |
| Immigrants | Middle Africa | 70.9 /100 | #155 | Good 11.1% |
| Russians | 69.8 /100 | #156 | Good 11.1% |
| Immigrants | Western Africa | 69.2 /100 | #157 | Good 11.1% |
| Latvians | 68.1 /100 | #158 | Good 11.1% |
| Guatemalans | 67.2 /100 | #159 | Good 11.1% |
| Albanians | 66.5 /100 | #160 | Good 11.1% |
| Immigrants | West Indies | 65.7 /100 | #161 | Good 11.1% |
| Immigrants | Haiti | 65.3 /100 | #162 | Good 11.1% |
| Immigrants | Kenya | 63.8 /100 | #163 | Good 11.1% |
| British West Indians | 62.8 /100 | #164 | Good 11.1% |
| Luxembourgers | 61.9 /100 | #165 | Good 11.1% |
| Immigrants | Hungary | 61.2 /100 | #166 | Good 11.1% |
| Immigrants | Southern Europe | 54.4 /100 | #167 | Average 11.2% |
| Immigrants | Latin America | 54.0 /100 | #168 | Average 11.2% |
| Barbadians | 53.4 /100 | #169 | Average 11.2% |
| New Zealanders | 52.9 /100 | #170 | Average 11.2% |