Immigrants from Lebanon vs Immigrants from Uruguay Self-Care Disability
COMPARE
Immigrants from Lebanon
Immigrants from Uruguay
Self-Care Disability
Self-Care Disability Comparison
Immigrants from Lebanon
Immigrants from Uruguay
2.5%
SELF-CARE DISABILITY
12.4/ 100
METRIC RATING
203rd/ 347
METRIC RANK
2.4%
SELF-CARE DISABILITY
85.4/ 100
METRIC RATING
140th/ 347
METRIC RANK
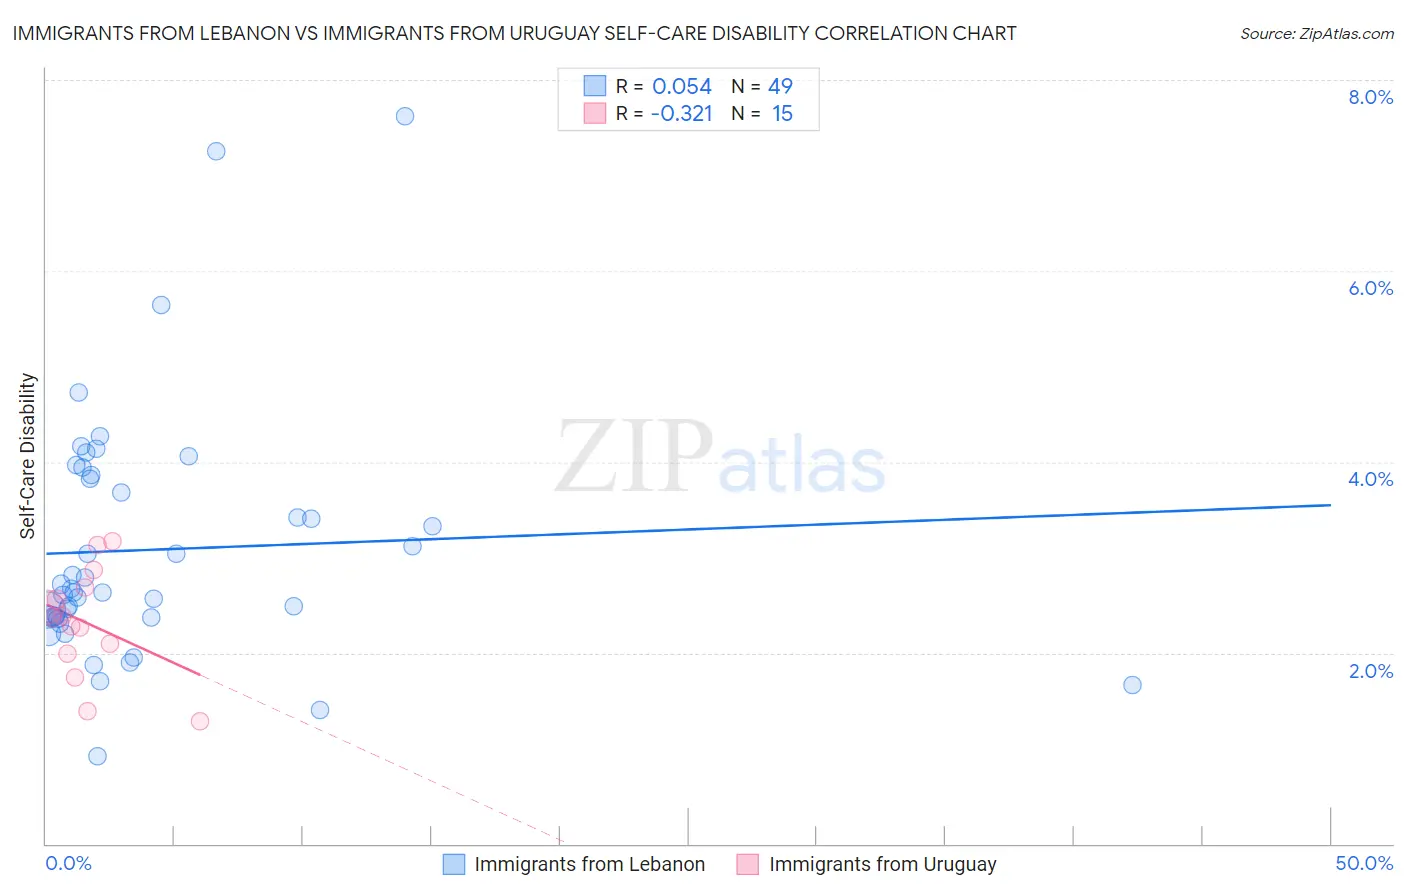
Immigrants from Lebanon vs Immigrants from Uruguay Self-Care Disability Correlation Chart
The statistical analysis conducted on geographies consisting of 217,055,251 people shows a slight positive correlation between the proportion of Immigrants from Lebanon and percentage of population with self-care disability in the United States with a correlation coefficient (R) of 0.054 and weighted average of 2.5%. Similarly, the statistical analysis conducted on geographies consisting of 133,239,464 people shows a mild negative correlation between the proportion of Immigrants from Uruguay and percentage of population with self-care disability in the United States with a correlation coefficient (R) of -0.321 and weighted average of 2.4%, a difference of 4.5%.
Self-Care Disability Correlation Summary
| Measurement | Immigrants from Lebanon | Immigrants from Uruguay |
| Minimum | 0.92% | 1.3% |
| Maximum | 7.6% | 3.2% |
| Range | 6.7% | 1.9% |
| Mean | 3.1% | 2.3% |
| Median | 2.6% | 2.4% |
| Interquartile 25% (IQ1) | 2.4% | 2.0% |
| Interquartile 75% (IQ3) | 3.8% | 2.7% |
| Interquartile Range (IQR) | 1.5% | 0.69% |
| Standard Deviation (Sample) | 1.3% | 0.56% |
| Standard Deviation (Population) | 1.3% | 0.54% |
Similar Demographics by Self-Care Disability
Demographics Similar to Immigrants from Lebanon by Self-Care Disability
In terms of self-care disability, the demographic groups most similar to Immigrants from Lebanon are Slovak (2.5%, a difference of 0.020%), Immigrants from South Eastern Asia (2.5%, a difference of 0.050%), Immigrants from Bahamas (2.5%, a difference of 0.050%), Immigrants from Western Africa (2.5%, a difference of 0.090%), and Immigrants from Russia (2.5%, a difference of 0.15%).
| Demographics | Rating | Rank | Self-Care Disability |
| Koreans | 15.5 /100 | #196 | Poor 2.5% |
| Crow | 15.2 /100 | #197 | Poor 2.5% |
| Immigrants | Immigrants | 15.0 /100 | #198 | Poor 2.5% |
| Immigrants | Ghana | 14.7 /100 | #199 | Poor 2.5% |
| Immigrants | Western Africa | 13.3 /100 | #200 | Poor 2.5% |
| Immigrants | South Eastern Asia | 12.9 /100 | #201 | Poor 2.5% |
| Slovaks | 12.6 /100 | #202 | Poor 2.5% |
| Immigrants | Lebanon | 12.4 /100 | #203 | Poor 2.5% |
| Immigrants | Bahamas | 11.9 /100 | #204 | Poor 2.5% |
| Immigrants | Russia | 11.0 /100 | #205 | Poor 2.5% |
| Alaskan Athabascans | 10.4 /100 | #206 | Poor 2.5% |
| French | 9.9 /100 | #207 | Tragic 2.5% |
| Central Americans | 8.7 /100 | #208 | Tragic 2.5% |
| Malaysians | 7.7 /100 | #209 | Tragic 2.5% |
| Panamanians | 6.4 /100 | #210 | Tragic 2.5% |
Demographics Similar to Immigrants from Uruguay by Self-Care Disability
In terms of self-care disability, the demographic groups most similar to Immigrants from Uruguay are Alaska Native (2.4%, a difference of 0.090%), Immigrants from Croatia (2.4%, a difference of 0.12%), Sri Lankan (2.4%, a difference of 0.12%), Austrian (2.4%, a difference of 0.17%), and South American Indian (2.4%, a difference of 0.19%).
| Demographics | Rating | Rank | Self-Care Disability |
| Immigrants | Colombia | 88.5 /100 | #133 | Excellent 2.4% |
| Russians | 88.2 /100 | #134 | Excellent 2.4% |
| Laotians | 87.8 /100 | #135 | Excellent 2.4% |
| South American Indians | 87.2 /100 | #136 | Excellent 2.4% |
| Austrians | 87.0 /100 | #137 | Excellent 2.4% |
| Immigrants | Croatia | 86.6 /100 | #138 | Excellent 2.4% |
| Sri Lankans | 86.6 /100 | #139 | Excellent 2.4% |
| Immigrants | Uruguay | 85.4 /100 | #140 | Excellent 2.4% |
| Alaska Natives | 84.5 /100 | #141 | Excellent 2.4% |
| Immigrants | Peru | 83.2 /100 | #142 | Excellent 2.4% |
| Afghans | 82.3 /100 | #143 | Excellent 2.4% |
| Costa Ricans | 80.8 /100 | #144 | Excellent 2.4% |
| Germans | 80.1 /100 | #145 | Excellent 2.4% |
| Israelis | 80.0 /100 | #146 | Good 2.4% |
| Dutch | 77.5 /100 | #147 | Good 2.4% |