Immigrants from Lebanon vs Immigrants from Haiti Self-Care Disability
COMPARE
Immigrants from Lebanon
Immigrants from Haiti
Self-Care Disability
Self-Care Disability Comparison
Immigrants from Lebanon
Immigrants from Haiti
2.5%
SELF-CARE DISABILITY
12.4/ 100
METRIC RATING
203rd/ 347
METRIC RANK
2.6%
SELF-CARE DISABILITY
0.3/ 100
METRIC RATING
253rd/ 347
METRIC RANK
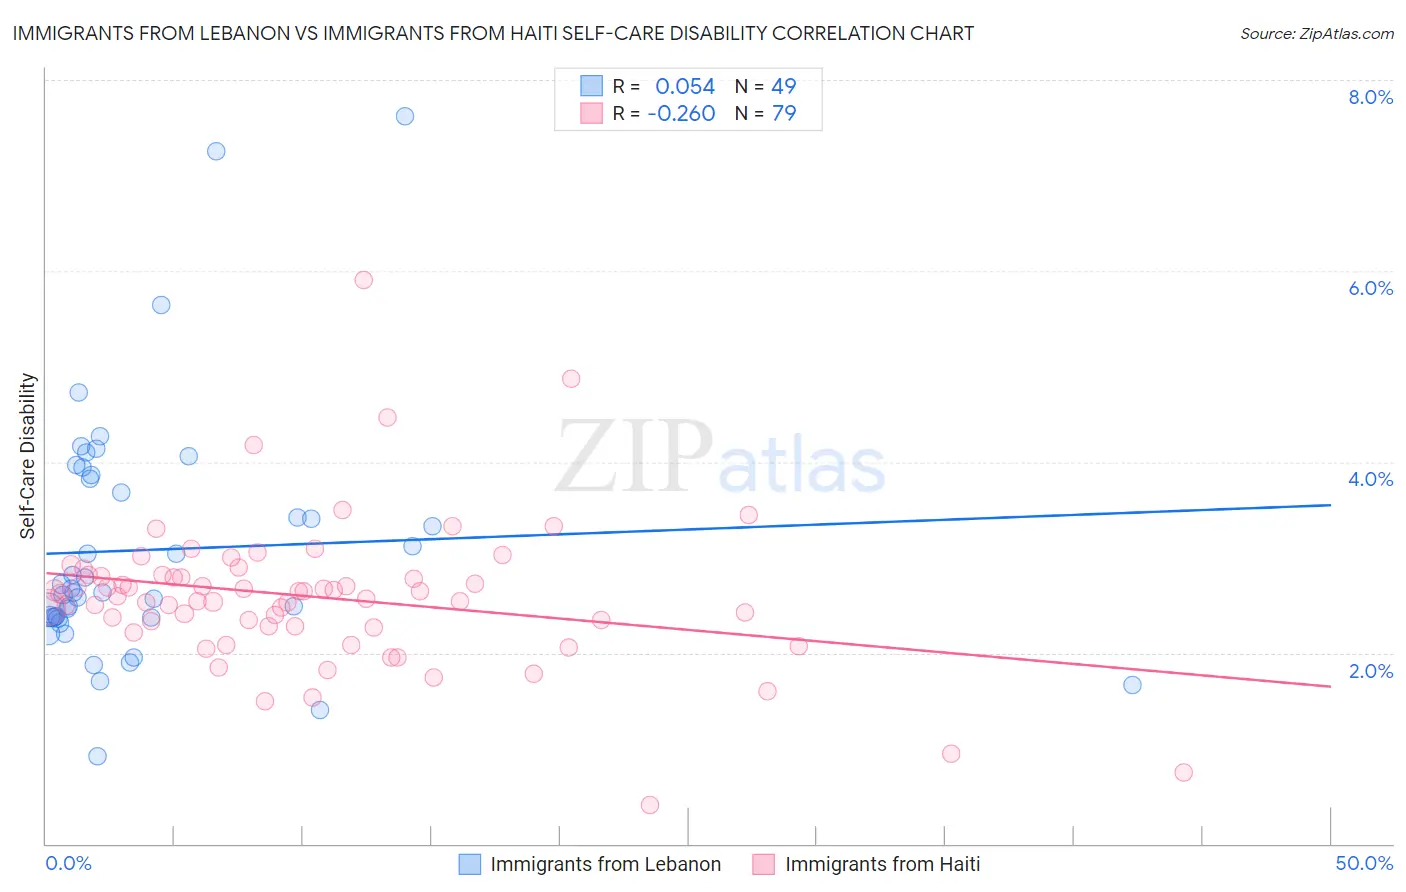
Immigrants from Lebanon vs Immigrants from Haiti Self-Care Disability Correlation Chart
The statistical analysis conducted on geographies consisting of 217,055,251 people shows a slight positive correlation between the proportion of Immigrants from Lebanon and percentage of population with self-care disability in the United States with a correlation coefficient (R) of 0.054 and weighted average of 2.5%. Similarly, the statistical analysis conducted on geographies consisting of 225,098,075 people shows a weak negative correlation between the proportion of Immigrants from Haiti and percentage of population with self-care disability in the United States with a correlation coefficient (R) of -0.260 and weighted average of 2.6%, a difference of 4.3%.
Self-Care Disability Correlation Summary
| Measurement | Immigrants from Lebanon | Immigrants from Haiti |
| Minimum | 0.92% | 0.41% |
| Maximum | 7.6% | 5.9% |
| Range | 6.7% | 5.5% |
| Mean | 3.1% | 2.6% |
| Median | 2.6% | 2.6% |
| Interquartile 25% (IQ1) | 2.4% | 2.3% |
| Interquartile 75% (IQ3) | 3.8% | 2.8% |
| Interquartile Range (IQR) | 1.5% | 0.53% |
| Standard Deviation (Sample) | 1.3% | 0.78% |
| Standard Deviation (Population) | 1.3% | 0.77% |
Similar Demographics by Self-Care Disability
Demographics Similar to Immigrants from Lebanon by Self-Care Disability
In terms of self-care disability, the demographic groups most similar to Immigrants from Lebanon are Slovak (2.5%, a difference of 0.020%), Immigrants from South Eastern Asia (2.5%, a difference of 0.050%), Immigrants from Bahamas (2.5%, a difference of 0.050%), Immigrants from Western Africa (2.5%, a difference of 0.090%), and Immigrants from Russia (2.5%, a difference of 0.15%).
| Demographics | Rating | Rank | Self-Care Disability |
| Koreans | 15.5 /100 | #196 | Poor 2.5% |
| Crow | 15.2 /100 | #197 | Poor 2.5% |
| Immigrants | Immigrants | 15.0 /100 | #198 | Poor 2.5% |
| Immigrants | Ghana | 14.7 /100 | #199 | Poor 2.5% |
| Immigrants | Western Africa | 13.3 /100 | #200 | Poor 2.5% |
| Immigrants | South Eastern Asia | 12.9 /100 | #201 | Poor 2.5% |
| Slovaks | 12.6 /100 | #202 | Poor 2.5% |
| Immigrants | Lebanon | 12.4 /100 | #203 | Poor 2.5% |
| Immigrants | Bahamas | 11.9 /100 | #204 | Poor 2.5% |
| Immigrants | Russia | 11.0 /100 | #205 | Poor 2.5% |
| Alaskan Athabascans | 10.4 /100 | #206 | Poor 2.5% |
| French | 9.9 /100 | #207 | Tragic 2.5% |
| Central Americans | 8.7 /100 | #208 | Tragic 2.5% |
| Malaysians | 7.7 /100 | #209 | Tragic 2.5% |
| Panamanians | 6.4 /100 | #210 | Tragic 2.5% |
Demographics Similar to Immigrants from Haiti by Self-Care Disability
In terms of self-care disability, the demographic groups most similar to Immigrants from Haiti are Haitian (2.6%, a difference of 0.020%), Tsimshian (2.6%, a difference of 0.060%), Immigrants from Bangladesh (2.6%, a difference of 0.080%), Immigrants from Central America (2.6%, a difference of 0.080%), and Immigrants from Liberia (2.6%, a difference of 0.15%).
| Demographics | Rating | Rank | Self-Care Disability |
| Cheyenne | 0.6 /100 | #246 | Tragic 2.6% |
| Immigrants | Albania | 0.6 /100 | #247 | Tragic 2.6% |
| Nicaraguans | 0.6 /100 | #248 | Tragic 2.6% |
| Mexican American Indians | 0.5 /100 | #249 | Tragic 2.6% |
| Portuguese | 0.4 /100 | #250 | Tragic 2.6% |
| Immigrants | Liberia | 0.4 /100 | #251 | Tragic 2.6% |
| Immigrants | Bangladesh | 0.4 /100 | #252 | Tragic 2.6% |
| Immigrants | Haiti | 0.3 /100 | #253 | Tragic 2.6% |
| Haitians | 0.3 /100 | #254 | Tragic 2.6% |
| Tsimshian | 0.3 /100 | #255 | Tragic 2.6% |
| Immigrants | Central America | 0.3 /100 | #256 | Tragic 2.6% |
| Potawatomi | 0.3 /100 | #257 | Tragic 2.6% |
| Immigrants | Nonimmigrants | 0.3 /100 | #258 | Tragic 2.6% |
| Immigrants | Belarus | 0.2 /100 | #259 | Tragic 2.6% |
| Chippewa | 0.2 /100 | #260 | Tragic 2.6% |