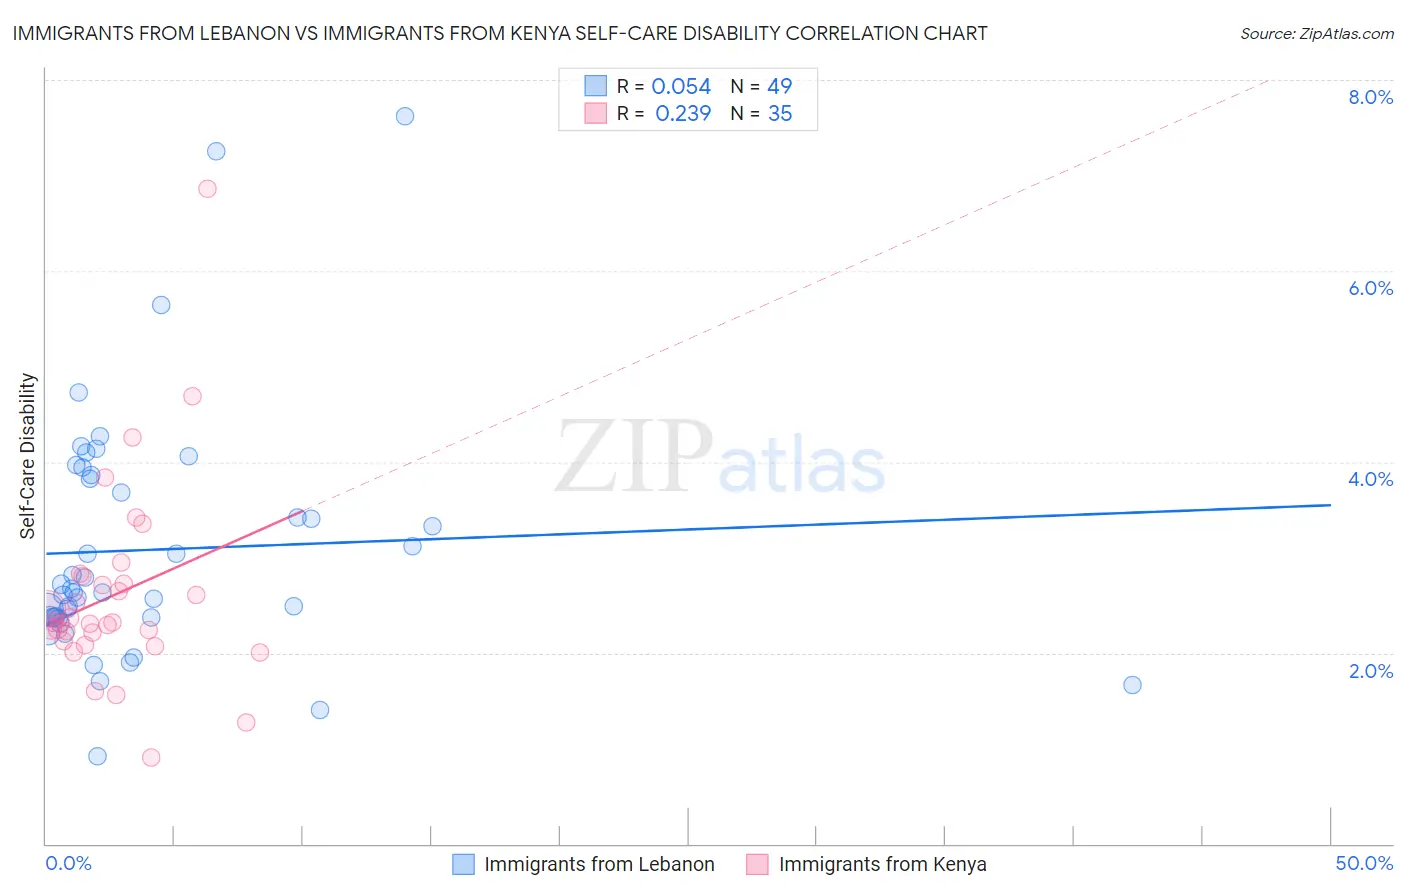
Immigrants from Lebanon vs Immigrants from Kenya Self-Care Disability
COMPARE
Immigrants from Lebanon
Immigrants from Kenya
Self-Care Disability
Self-Care Disability Comparison
Immigrants from Lebanon
Immigrants from Kenya
2.5%
SELF-CARE DISABILITY
12.4/ 100
METRIC RATING
203rd/ 347
METRIC RANK
2.3%
SELF-CARE DISABILITY
99.0/ 100
METRIC RATING
79th/ 347
METRIC RANK
Immigrants from Lebanon vs Immigrants from Kenya Self-Care Disability Correlation Chart
The statistical analysis conducted on geographies consisting of 217,055,251 people shows a slight positive correlation between the proportion of Immigrants from Lebanon and percentage of population with self-care disability in the United States with a correlation coefficient (R) of 0.054 and weighted average of 2.5%. Similarly, the statistical analysis conducted on geographies consisting of 217,918,601 people shows a weak positive correlation between the proportion of Immigrants from Kenya and percentage of population with self-care disability in the United States with a correlation coefficient (R) of 0.239 and weighted average of 2.3%, a difference of 8.2%.
Self-Care Disability Correlation Summary
| Measurement | Immigrants from Lebanon | Immigrants from Kenya |
| Minimum | 0.92% | 0.90% |
| Maximum | 7.6% | 6.9% |
| Range | 6.7% | 6.0% |
| Mean | 3.1% | 2.6% |
| Median | 2.6% | 2.3% |
| Interquartile 25% (IQ1) | 2.4% | 2.1% |
| Interquartile 75% (IQ3) | 3.8% | 2.8% |
| Interquartile Range (IQR) | 1.5% | 0.68% |
| Standard Deviation (Sample) | 1.3% | 1.1% |
| Standard Deviation (Population) | 1.3% | 1.0% |
Similar Demographics by Self-Care Disability
Demographics Similar to Immigrants from Lebanon by Self-Care Disability
In terms of self-care disability, the demographic groups most similar to Immigrants from Lebanon are Slovak (2.5%, a difference of 0.020%), Immigrants from South Eastern Asia (2.5%, a difference of 0.050%), Immigrants from Bahamas (2.5%, a difference of 0.050%), Immigrants from Western Africa (2.5%, a difference of 0.090%), and Immigrants from Russia (2.5%, a difference of 0.15%).
| Demographics | Rating | Rank | Self-Care Disability |
| Koreans | 15.5 /100 | #196 | Poor 2.5% |
| Crow | 15.2 /100 | #197 | Poor 2.5% |
| Immigrants | Immigrants | 15.0 /100 | #198 | Poor 2.5% |
| Immigrants | Ghana | 14.7 /100 | #199 | Poor 2.5% |
| Immigrants | Western Africa | 13.3 /100 | #200 | Poor 2.5% |
| Immigrants | South Eastern Asia | 12.9 /100 | #201 | Poor 2.5% |
| Slovaks | 12.6 /100 | #202 | Poor 2.5% |
| Immigrants | Lebanon | 12.4 /100 | #203 | Poor 2.5% |
| Immigrants | Bahamas | 11.9 /100 | #204 | Poor 2.5% |
| Immigrants | Russia | 11.0 /100 | #205 | Poor 2.5% |
| Alaskan Athabascans | 10.4 /100 | #206 | Poor 2.5% |
| French | 9.9 /100 | #207 | Tragic 2.5% |
| Central Americans | 8.7 /100 | #208 | Tragic 2.5% |
| Malaysians | 7.7 /100 | #209 | Tragic 2.5% |
| Panamanians | 6.4 /100 | #210 | Tragic 2.5% |
Demographics Similar to Immigrants from Kenya by Self-Care Disability
In terms of self-care disability, the demographic groups most similar to Immigrants from Kenya are Immigrants from Middle Africa (2.3%, a difference of 0.010%), Immigrants from Ireland (2.3%, a difference of 0.010%), Immigrants from China (2.3%, a difference of 0.090%), Immigrants from Netherlands (2.3%, a difference of 0.10%), and Immigrants from Switzerland (2.3%, a difference of 0.14%).
| Demographics | Rating | Rank | Self-Care Disability |
| Eastern Europeans | 99.2 /100 | #72 | Exceptional 2.3% |
| Immigrants | Egypt | 99.1 /100 | #73 | Exceptional 2.3% |
| Immigrants | Switzerland | 99.1 /100 | #74 | Exceptional 2.3% |
| Immigrants | Netherlands | 99.1 /100 | #75 | Exceptional 2.3% |
| Immigrants | China | 99.1 /100 | #76 | Exceptional 2.3% |
| Immigrants | Middle Africa | 99.0 /100 | #77 | Exceptional 2.3% |
| Immigrants | Ireland | 99.0 /100 | #78 | Exceptional 2.3% |
| Immigrants | Kenya | 99.0 /100 | #79 | Exceptional 2.3% |
| Chileans | 98.8 /100 | #80 | Exceptional 2.3% |
| Ugandans | 98.8 /100 | #81 | Exceptional 2.3% |
| Immigrants | Denmark | 98.8 /100 | #82 | Exceptional 2.3% |
| Indians (Asian) | 98.7 /100 | #83 | Exceptional 2.3% |
| Immigrants | Spain | 98.7 /100 | #84 | Exceptional 2.3% |
| Estonians | 98.3 /100 | #85 | Exceptional 2.3% |
| Immigrants | Northern Africa | 98.2 /100 | #86 | Exceptional 2.3% |