Hawaiian vs Immigrants from Uruguay Self-Care Disability
COMPARE
Hawaiian
Immigrants from Uruguay
Self-Care Disability
Self-Care Disability Comparison
Hawaiians
Immigrants from Uruguay
2.6%
SELF-CARE DISABILITY
0.8/ 100
METRIC RATING
243rd/ 347
METRIC RANK
2.4%
SELF-CARE DISABILITY
85.4/ 100
METRIC RATING
140th/ 347
METRIC RANK
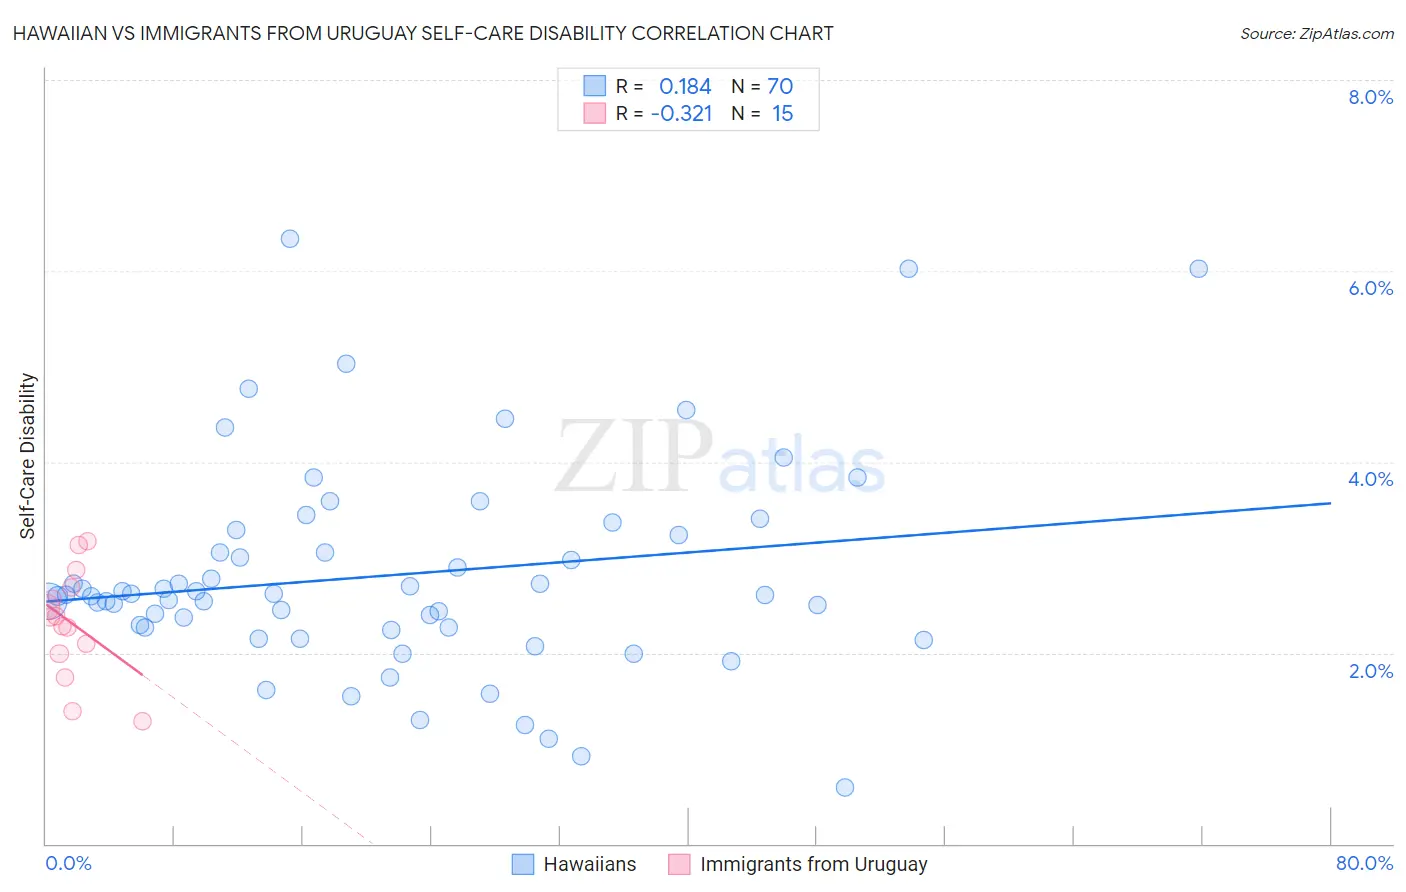
Hawaiian vs Immigrants from Uruguay Self-Care Disability Correlation Chart
The statistical analysis conducted on geographies consisting of 327,105,730 people shows a poor positive correlation between the proportion of Hawaiians and percentage of population with self-care disability in the United States with a correlation coefficient (R) of 0.184 and weighted average of 2.6%. Similarly, the statistical analysis conducted on geographies consisting of 133,239,464 people shows a mild negative correlation between the proportion of Immigrants from Uruguay and percentage of population with self-care disability in the United States with a correlation coefficient (R) of -0.321 and weighted average of 2.4%, a difference of 8.0%.
Self-Care Disability Correlation Summary
| Measurement | Hawaiian | Immigrants from Uruguay |
| Minimum | 0.59% | 1.3% |
| Maximum | 6.3% | 3.2% |
| Range | 5.8% | 1.9% |
| Mean | 2.8% | 2.3% |
| Median | 2.6% | 2.4% |
| Interquartile 25% (IQ1) | 2.3% | 2.0% |
| Interquartile 75% (IQ3) | 3.2% | 2.7% |
| Interquartile Range (IQR) | 0.97% | 0.69% |
| Standard Deviation (Sample) | 1.1% | 0.56% |
| Standard Deviation (Population) | 1.1% | 0.54% |
Similar Demographics by Self-Care Disability
Demographics Similar to Hawaiians by Self-Care Disability
In terms of self-care disability, the demographic groups most similar to Hawaiians are Yuman (2.6%, a difference of 0.040%), Spanish (2.6%, a difference of 0.070%), Immigrants from Western Asia (2.6%, a difference of 0.23%), Cheyenne (2.6%, a difference of 0.25%), and Immigrants from Syria (2.6%, a difference of 0.31%).
| Demographics | Rating | Rank | Self-Care Disability |
| Bermudans | 1.9 /100 | #236 | Tragic 2.6% |
| Immigrants | Senegal | 1.6 /100 | #237 | Tragic 2.6% |
| Senegalese | 1.3 /100 | #238 | Tragic 2.6% |
| Immigrants | Panama | 1.2 /100 | #239 | Tragic 2.6% |
| Marshallese | 1.2 /100 | #240 | Tragic 2.6% |
| Immigrants | Syria | 1.0 /100 | #241 | Tragic 2.6% |
| Spanish | 0.8 /100 | #242 | Tragic 2.6% |
| Hawaiians | 0.8 /100 | #243 | Tragic 2.6% |
| Yuman | 0.8 /100 | #244 | Tragic 2.6% |
| Immigrants | Western Asia | 0.6 /100 | #245 | Tragic 2.6% |
| Cheyenne | 0.6 /100 | #246 | Tragic 2.6% |
| Immigrants | Albania | 0.6 /100 | #247 | Tragic 2.6% |
| Nicaraguans | 0.6 /100 | #248 | Tragic 2.6% |
| Mexican American Indians | 0.5 /100 | #249 | Tragic 2.6% |
| Portuguese | 0.4 /100 | #250 | Tragic 2.6% |
Demographics Similar to Immigrants from Uruguay by Self-Care Disability
In terms of self-care disability, the demographic groups most similar to Immigrants from Uruguay are Alaska Native (2.4%, a difference of 0.090%), Immigrants from Croatia (2.4%, a difference of 0.12%), Sri Lankan (2.4%, a difference of 0.12%), Austrian (2.4%, a difference of 0.17%), and South American Indian (2.4%, a difference of 0.19%).
| Demographics | Rating | Rank | Self-Care Disability |
| Immigrants | Colombia | 88.5 /100 | #133 | Excellent 2.4% |
| Russians | 88.2 /100 | #134 | Excellent 2.4% |
| Laotians | 87.8 /100 | #135 | Excellent 2.4% |
| South American Indians | 87.2 /100 | #136 | Excellent 2.4% |
| Austrians | 87.0 /100 | #137 | Excellent 2.4% |
| Immigrants | Croatia | 86.6 /100 | #138 | Excellent 2.4% |
| Sri Lankans | 86.6 /100 | #139 | Excellent 2.4% |
| Immigrants | Uruguay | 85.4 /100 | #140 | Excellent 2.4% |
| Alaska Natives | 84.5 /100 | #141 | Excellent 2.4% |
| Immigrants | Peru | 83.2 /100 | #142 | Excellent 2.4% |
| Afghans | 82.3 /100 | #143 | Excellent 2.4% |
| Costa Ricans | 80.8 /100 | #144 | Excellent 2.4% |
| Germans | 80.1 /100 | #145 | Excellent 2.4% |
| Israelis | 80.0 /100 | #146 | Good 2.4% |
| Dutch | 77.5 /100 | #147 | Good 2.4% |