Immigrants from Western Europe vs Immigrants from Uruguay Self-Care Disability
COMPARE
Immigrants from Western Europe
Immigrants from Uruguay
Self-Care Disability
Self-Care Disability Comparison
Immigrants from Western Europe
Immigrants from Uruguay
2.4%
SELF-CARE DISABILITY
68.6/ 100
METRIC RATING
158th/ 347
METRIC RANK
2.4%
SELF-CARE DISABILITY
85.4/ 100
METRIC RATING
140th/ 347
METRIC RANK
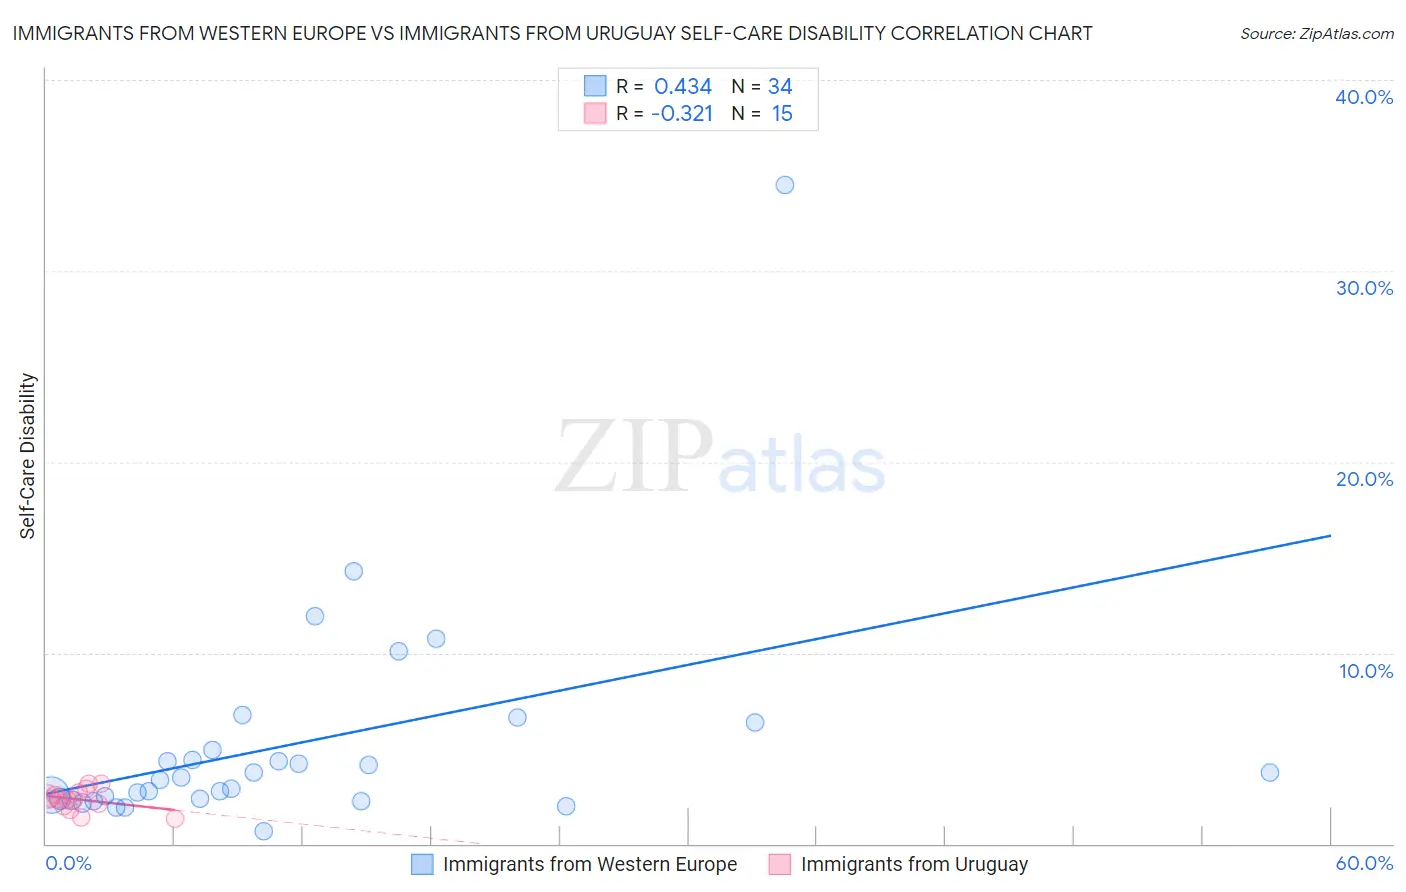
Immigrants from Western Europe vs Immigrants from Uruguay Self-Care Disability Correlation Chart
The statistical analysis conducted on geographies consisting of 493,216,023 people shows a moderate positive correlation between the proportion of Immigrants from Western Europe and percentage of population with self-care disability in the United States with a correlation coefficient (R) of 0.434 and weighted average of 2.4%. Similarly, the statistical analysis conducted on geographies consisting of 133,239,464 people shows a mild negative correlation between the proportion of Immigrants from Uruguay and percentage of population with self-care disability in the United States with a correlation coefficient (R) of -0.321 and weighted average of 2.4%, a difference of 1.2%.
Self-Care Disability Correlation Summary
| Measurement | Immigrants from Western Europe | Immigrants from Uruguay |
| Minimum | 0.64% | 1.3% |
| Maximum | 34.5% | 3.2% |
| Range | 33.8% | 1.9% |
| Mean | 5.2% | 2.3% |
| Median | 3.4% | 2.4% |
| Interquartile 25% (IQ1) | 2.4% | 2.0% |
| Interquartile 75% (IQ3) | 4.9% | 2.7% |
| Interquartile Range (IQR) | 2.6% | 0.69% |
| Standard Deviation (Sample) | 6.0% | 0.56% |
| Standard Deviation (Population) | 5.9% | 0.54% |
Demographics Similar to Immigrants from Western Europe and Immigrants from Uruguay by Self-Care Disability
In terms of self-care disability, the demographic groups most similar to Immigrants from Western Europe are Immigrants from Italy (2.4%, a difference of 0.0%), Immigrants from Europe (2.4%, a difference of 0.060%), Nigerian (2.4%, a difference of 0.12%), Pakistani (2.4%, a difference of 0.16%), and Italian (2.4%, a difference of 0.21%). Similarly, the demographic groups most similar to Immigrants from Uruguay are Alaska Native (2.4%, a difference of 0.090%), Sri Lankan (2.4%, a difference of 0.12%), Immigrants from Peru (2.4%, a difference of 0.20%), Afghan (2.4%, a difference of 0.28%), and Costa Rican (2.4%, a difference of 0.40%).
| Demographics | Rating | Rank | Self-Care Disability |
| Sri Lankans | 86.6 /100 | #139 | Excellent 2.4% |
| Immigrants | Uruguay | 85.4 /100 | #140 | Excellent 2.4% |
| Alaska Natives | 84.5 /100 | #141 | Excellent 2.4% |
| Immigrants | Peru | 83.2 /100 | #142 | Excellent 2.4% |
| Afghans | 82.3 /100 | #143 | Excellent 2.4% |
| Costa Ricans | 80.8 /100 | #144 | Excellent 2.4% |
| Germans | 80.1 /100 | #145 | Excellent 2.4% |
| Israelis | 80.0 /100 | #146 | Good 2.4% |
| Dutch | 77.5 /100 | #147 | Good 2.4% |
| Romanians | 75.8 /100 | #148 | Good 2.4% |
| Arabs | 75.7 /100 | #149 | Good 2.4% |
| Immigrants | Costa Rica | 75.1 /100 | #150 | Good 2.4% |
| Basques | 74.0 /100 | #151 | Good 2.4% |
| Tlingit-Haida | 73.5 /100 | #152 | Good 2.4% |
| Immigrants | England | 73.5 /100 | #153 | Good 2.4% |
| Italians | 72.2 /100 | #154 | Good 2.4% |
| Pakistanis | 71.4 /100 | #155 | Good 2.4% |
| Nigerians | 70.6 /100 | #156 | Good 2.4% |
| Immigrants | Europe | 69.6 /100 | #157 | Good 2.4% |
| Immigrants | Western Europe | 68.6 /100 | #158 | Good 2.4% |
| Immigrants | Italy | 68.5 /100 | #159 | Good 2.4% |