Kiowa vs Immigrants from Uruguay Self-Care Disability
COMPARE
Kiowa
Immigrants from Uruguay
Self-Care Disability
Self-Care Disability Comparison
Kiowa
Immigrants from Uruguay
3.0%
SELF-CARE DISABILITY
0.0/ 100
METRIC RATING
332nd/ 347
METRIC RANK
2.4%
SELF-CARE DISABILITY
85.4/ 100
METRIC RATING
140th/ 347
METRIC RANK
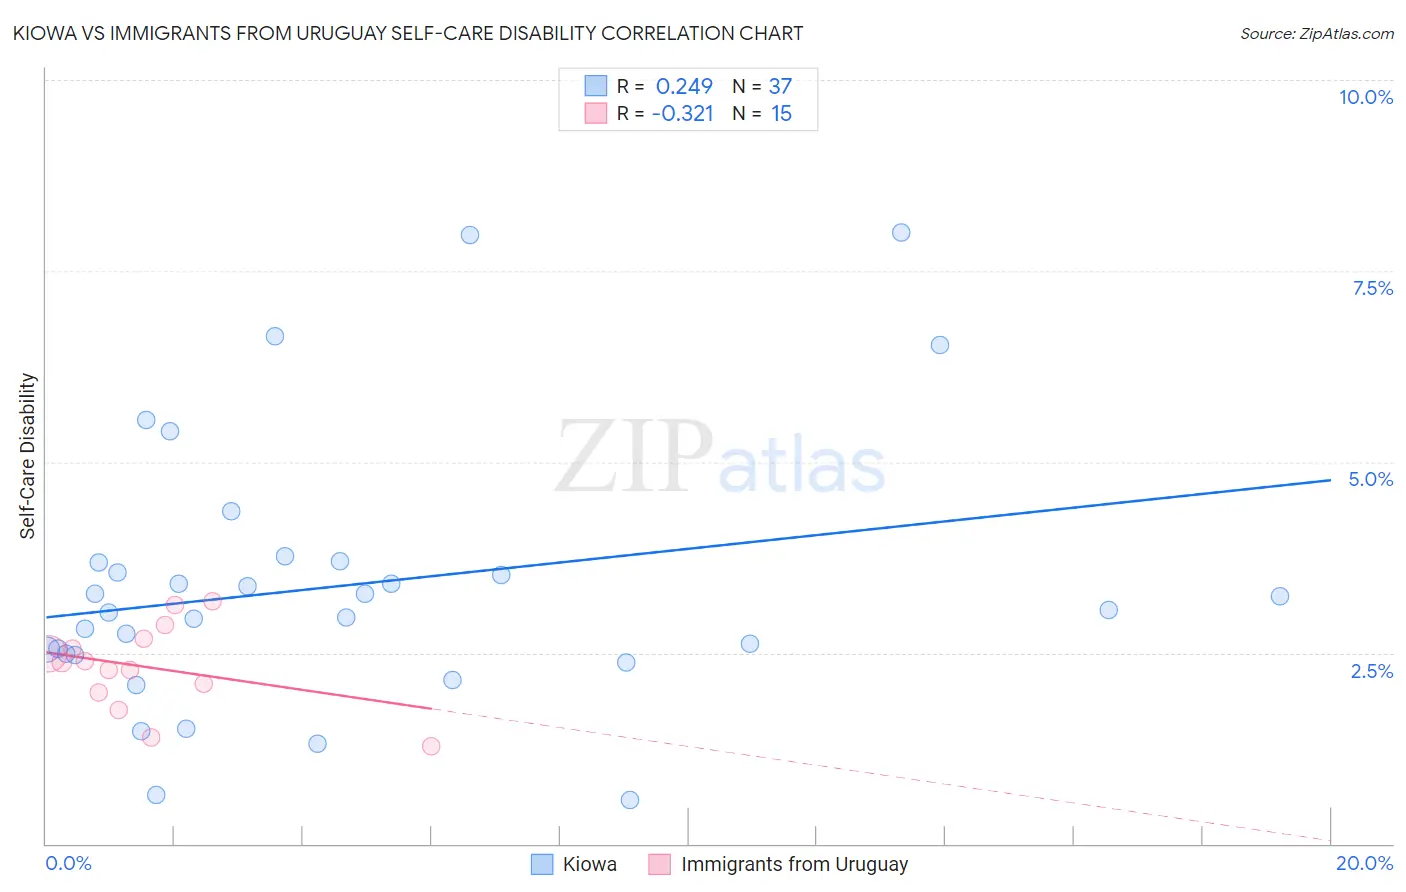
Kiowa vs Immigrants from Uruguay Self-Care Disability Correlation Chart
The statistical analysis conducted on geographies consisting of 56,085,215 people shows a weak positive correlation between the proportion of Kiowa and percentage of population with self-care disability in the United States with a correlation coefficient (R) of 0.249 and weighted average of 3.0%. Similarly, the statistical analysis conducted on geographies consisting of 133,239,464 people shows a mild negative correlation between the proportion of Immigrants from Uruguay and percentage of population with self-care disability in the United States with a correlation coefficient (R) of -0.321 and weighted average of 2.4%, a difference of 23.3%.
Self-Care Disability Correlation Summary
| Measurement | Kiowa | Immigrants from Uruguay |
| Minimum | 0.57% | 1.3% |
| Maximum | 8.0% | 3.2% |
| Range | 7.4% | 1.9% |
| Mean | 3.4% | 2.3% |
| Median | 3.1% | 2.4% |
| Interquartile 25% (IQ1) | 2.5% | 2.0% |
| Interquartile 75% (IQ3) | 3.7% | 2.7% |
| Interquartile Range (IQR) | 1.2% | 0.69% |
| Standard Deviation (Sample) | 1.7% | 0.56% |
| Standard Deviation (Population) | 1.7% | 0.54% |
Similar Demographics by Self-Care Disability
Demographics Similar to Kiowa by Self-Care Disability
In terms of self-care disability, the demographic groups most similar to Kiowa are Dutch West Indian (3.0%, a difference of 0.23%), Houma (3.0%, a difference of 0.30%), Immigrants from the Azores (3.0%, a difference of 0.35%), Lumbee (3.0%, a difference of 0.36%), and Nepalese (3.0%, a difference of 0.47%).
| Demographics | Rating | Rank | Self-Care Disability |
| Immigrants | Uzbekistan | 0.0 /100 | #325 | Tragic 2.9% |
| Paiute | 0.0 /100 | #326 | Tragic 2.9% |
| Blacks/African Americans | 0.0 /100 | #327 | Tragic 2.9% |
| Hopi | 0.0 /100 | #328 | Tragic 2.9% |
| Cajuns | 0.0 /100 | #329 | Tragic 2.9% |
| Nepalese | 0.0 /100 | #330 | Tragic 3.0% |
| Lumbee | 0.0 /100 | #331 | Tragic 3.0% |
| Kiowa | 0.0 /100 | #332 | Tragic 3.0% |
| Dutch West Indians | 0.0 /100 | #333 | Tragic 3.0% |
| Houma | 0.0 /100 | #334 | Tragic 3.0% |
| Immigrants | Azores | 0.0 /100 | #335 | Tragic 3.0% |
| Immigrants | Yemen | 0.0 /100 | #336 | Tragic 3.0% |
| Choctaw | 0.0 /100 | #337 | Tragic 3.0% |
| Cape Verdeans | 0.0 /100 | #338 | Tragic 3.0% |
| Immigrants | Dominican Republic | 0.0 /100 | #339 | Tragic 3.0% |
Demographics Similar to Immigrants from Uruguay by Self-Care Disability
In terms of self-care disability, the demographic groups most similar to Immigrants from Uruguay are Alaska Native (2.4%, a difference of 0.090%), Immigrants from Croatia (2.4%, a difference of 0.12%), Sri Lankan (2.4%, a difference of 0.12%), Austrian (2.4%, a difference of 0.17%), and South American Indian (2.4%, a difference of 0.19%).
| Demographics | Rating | Rank | Self-Care Disability |
| Immigrants | Colombia | 88.5 /100 | #133 | Excellent 2.4% |
| Russians | 88.2 /100 | #134 | Excellent 2.4% |
| Laotians | 87.8 /100 | #135 | Excellent 2.4% |
| South American Indians | 87.2 /100 | #136 | Excellent 2.4% |
| Austrians | 87.0 /100 | #137 | Excellent 2.4% |
| Immigrants | Croatia | 86.6 /100 | #138 | Excellent 2.4% |
| Sri Lankans | 86.6 /100 | #139 | Excellent 2.4% |
| Immigrants | Uruguay | 85.4 /100 | #140 | Excellent 2.4% |
| Alaska Natives | 84.5 /100 | #141 | Excellent 2.4% |
| Immigrants | Peru | 83.2 /100 | #142 | Excellent 2.4% |
| Afghans | 82.3 /100 | #143 | Excellent 2.4% |
| Costa Ricans | 80.8 /100 | #144 | Excellent 2.4% |
| Germans | 80.1 /100 | #145 | Excellent 2.4% |
| Israelis | 80.0 /100 | #146 | Good 2.4% |
| Dutch | 77.5 /100 | #147 | Good 2.4% |