Immigrants from Korea vs Immigrants from Jamaica Disability
COMPARE
Immigrants from Korea
Immigrants from Jamaica
Disability
Disability Comparison
Immigrants from Korea
Immigrants from Jamaica
10.2%
DISABILITY
100.0/ 100
METRIC RATING
14th/ 347
METRIC RANK
12.1%
DISABILITY
5.0/ 100
METRIC RATING
218th/ 347
METRIC RANK
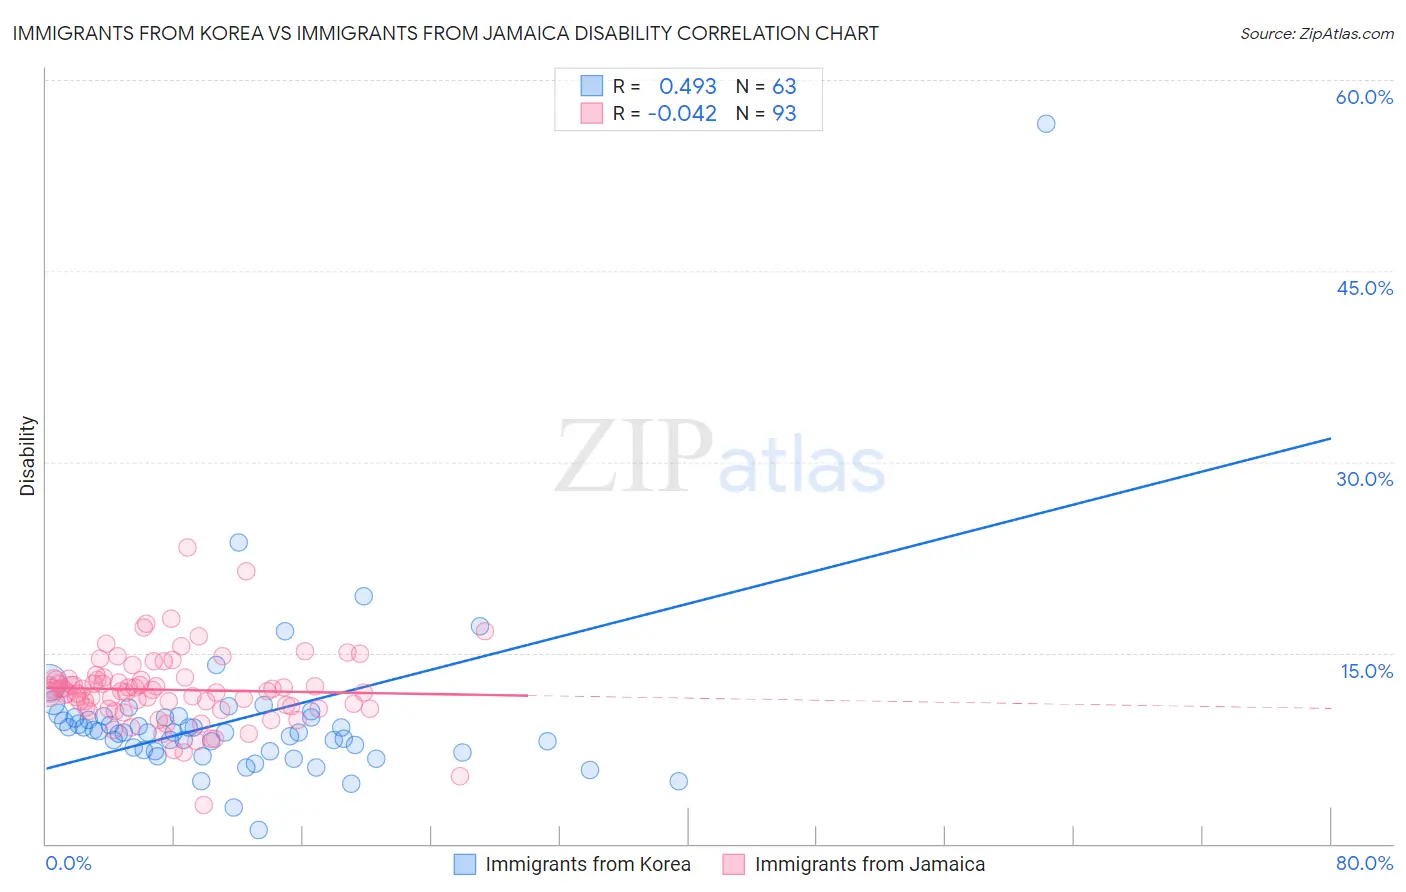
Immigrants from Korea vs Immigrants from Jamaica Disability Correlation Chart
The statistical analysis conducted on geographies consisting of 416,299,820 people shows a moderate positive correlation between the proportion of Immigrants from Korea and percentage of population with a disability in the United States with a correlation coefficient (R) of 0.493 and weighted average of 10.2%. Similarly, the statistical analysis conducted on geographies consisting of 301,749,565 people shows no correlation between the proportion of Immigrants from Jamaica and percentage of population with a disability in the United States with a correlation coefficient (R) of -0.042 and weighted average of 12.1%, a difference of 18.2%.
Disability Correlation Summary
| Measurement | Immigrants from Korea | Immigrants from Jamaica |
| Minimum | 1.1% | 3.0% |
| Maximum | 56.6% | 23.2% |
| Range | 55.5% | 20.2% |
| Mean | 9.8% | 12.1% |
| Median | 8.8% | 12.0% |
| Interquartile 25% (IQ1) | 7.3% | 10.7% |
| Interquartile 75% (IQ3) | 9.9% | 12.9% |
| Interquartile Range (IQR) | 2.6% | 2.3% |
| Standard Deviation (Sample) | 6.9% | 2.9% |
| Standard Deviation (Population) | 6.9% | 2.9% |
Similar Demographics by Disability
Demographics Similar to Immigrants from Korea by Disability
In terms of disability, the demographic groups most similar to Immigrants from Korea are Okinawan (10.3%, a difference of 0.31%), Indian (Asian) (10.3%, a difference of 0.37%), Immigrants from Iran (10.3%, a difference of 0.44%), Immigrants from Eastern Asia (10.2%, a difference of 0.60%), and Immigrants from Israel (10.1%, a difference of 0.81%).
| Demographics | Rating | Rank | Disability |
| Immigrants | Singapore | 100.0 /100 | #7 | Exceptional 10.0% |
| Bolivians | 100.0 /100 | #8 | Exceptional 10.0% |
| Immigrants | Hong Kong | 100.0 /100 | #9 | Exceptional 10.0% |
| Immigrants | China | 100.0 /100 | #10 | Exceptional 10.1% |
| Iranians | 100.0 /100 | #11 | Exceptional 10.1% |
| Immigrants | Israel | 100.0 /100 | #12 | Exceptional 10.1% |
| Immigrants | Eastern Asia | 100.0 /100 | #13 | Exceptional 10.2% |
| Immigrants | Korea | 100.0 /100 | #14 | Exceptional 10.2% |
| Okinawans | 100.0 /100 | #15 | Exceptional 10.3% |
| Indians (Asian) | 100.0 /100 | #16 | Exceptional 10.3% |
| Immigrants | Iran | 100.0 /100 | #17 | Exceptional 10.3% |
| Burmese | 100.0 /100 | #18 | Exceptional 10.4% |
| Immigrants | Pakistan | 100.0 /100 | #19 | Exceptional 10.4% |
| Immigrants | Venezuela | 100.0 /100 | #20 | Exceptional 10.4% |
| Asians | 100.0 /100 | #21 | Exceptional 10.4% |
Demographics Similar to Immigrants from Jamaica by Disability
In terms of disability, the demographic groups most similar to Immigrants from Jamaica are Croatian (12.1%, a difference of 0.040%), Immigrants from North America (12.1%, a difference of 0.060%), Panamanian (12.1%, a difference of 0.070%), Immigrants from Bahamas (12.1%, a difference of 0.080%), and Northern European (12.1%, a difference of 0.20%).
| Demographics | Rating | Rank | Disability |
| Immigrants | Cambodia | 7.3 /100 | #211 | Tragic 12.0% |
| Austrians | 7.2 /100 | #212 | Tragic 12.0% |
| Immigrants | Iraq | 7.1 /100 | #213 | Tragic 12.0% |
| Immigrants | Somalia | 6.8 /100 | #214 | Tragic 12.0% |
| Immigrants | Canada | 6.1 /100 | #215 | Tragic 12.1% |
| Panamanians | 5.4 /100 | #216 | Tragic 12.1% |
| Immigrants | North America | 5.3 /100 | #217 | Tragic 12.1% |
| Immigrants | Jamaica | 5.0 /100 | #218 | Tragic 12.1% |
| Croatians | 4.9 /100 | #219 | Tragic 12.1% |
| Immigrants | Bahamas | 4.7 /100 | #220 | Tragic 12.1% |
| Northern Europeans | 4.2 /100 | #221 | Tragic 12.1% |
| Spanish American Indians | 4.1 /100 | #222 | Tragic 12.1% |
| Hispanics or Latinos | 3.9 /100 | #223 | Tragic 12.1% |
| Mexicans | 3.7 /100 | #224 | Tragic 12.1% |
| Senegalese | 3.5 /100 | #225 | Tragic 12.1% |