Immigrants from Korea vs Inupiat Cognitive Disability
COMPARE
Immigrants from Korea
Inupiat
Cognitive Disability
Cognitive Disability Comparison
Immigrants from Korea
Inupiat
16.5%
COGNITIVE DISABILITY
99.8/ 100
METRIC RATING
51st/ 347
METRIC RANK
16.9%
COGNITIVE DISABILITY
96.5/ 100
METRIC RATING
116th/ 347
METRIC RANK
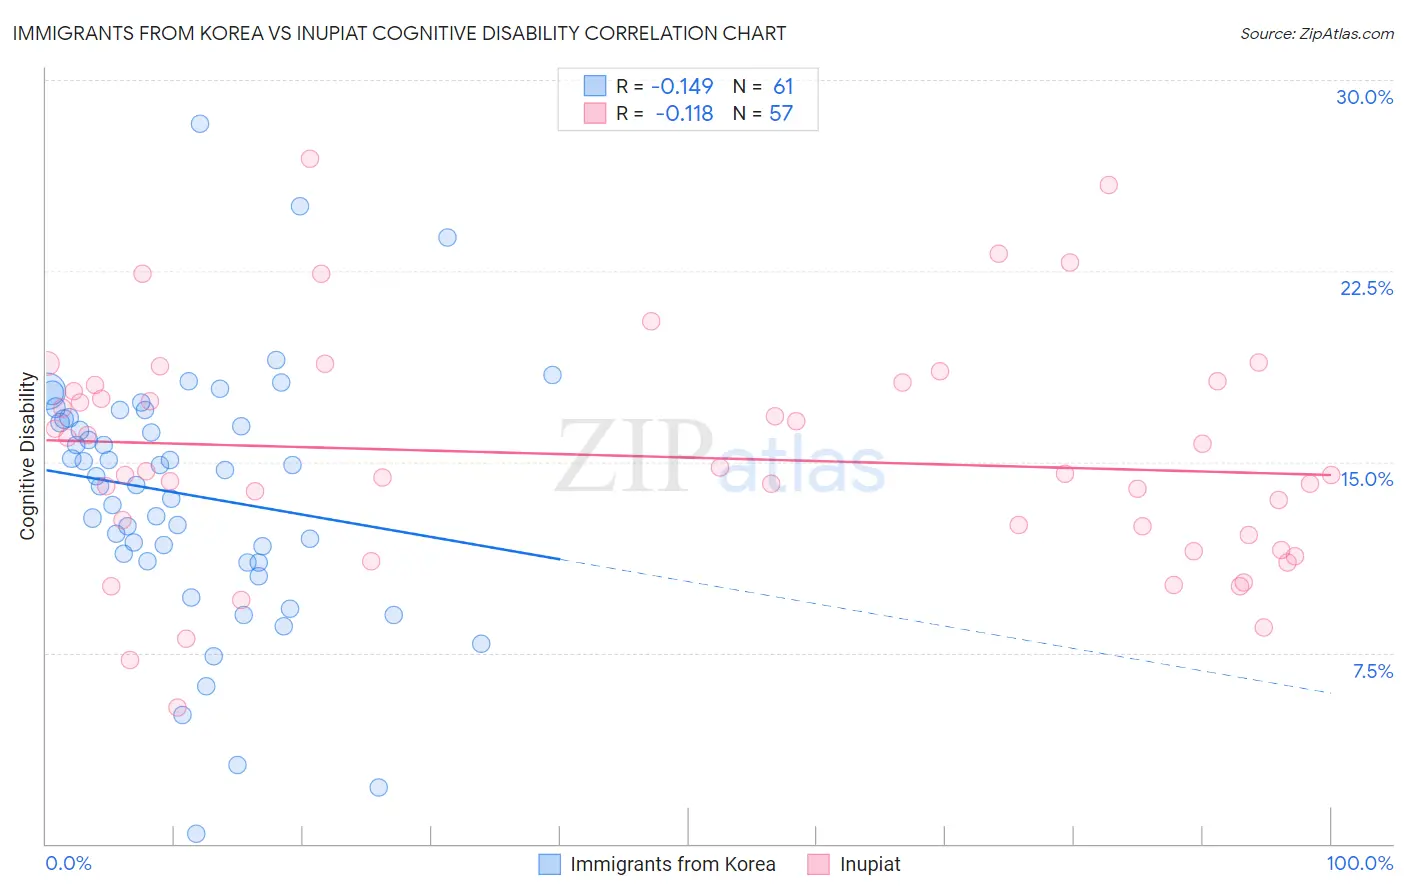
Immigrants from Korea vs Inupiat Cognitive Disability Correlation Chart
The statistical analysis conducted on geographies consisting of 416,300,035 people shows a poor negative correlation between the proportion of Immigrants from Korea and percentage of population with cognitive disability in the United States with a correlation coefficient (R) of -0.149 and weighted average of 16.5%. Similarly, the statistical analysis conducted on geographies consisting of 96,337,062 people shows a poor negative correlation between the proportion of Inupiat and percentage of population with cognitive disability in the United States with a correlation coefficient (R) of -0.118 and weighted average of 16.9%, a difference of 2.2%.
Cognitive Disability Correlation Summary
| Measurement | Immigrants from Korea | Inupiat |
| Minimum | 0.40% | 5.4% |
| Maximum | 28.3% | 26.9% |
| Range | 27.9% | 21.6% |
| Mean | 13.7% | 15.2% |
| Median | 14.4% | 14.5% |
| Interquartile 25% (IQ1) | 11.1% | 11.8% |
| Interquartile 75% (IQ3) | 16.7% | 18.1% |
| Interquartile Range (IQR) | 5.6% | 6.2% |
| Standard Deviation (Sample) | 5.0% | 4.5% |
| Standard Deviation (Population) | 4.9% | 4.5% |
Similar Demographics by Cognitive Disability
Demographics Similar to Immigrants from Korea by Cognitive Disability
In terms of cognitive disability, the demographic groups most similar to Immigrants from Korea are Soviet Union (16.5%, a difference of 0.040%), Iranian (16.5%, a difference of 0.050%), Norwegian (16.5%, a difference of 0.050%), Immigrants from Italy (16.5%, a difference of 0.090%), and Immigrants from North America (16.5%, a difference of 0.090%).
| Demographics | Rating | Rank | Cognitive Disability |
| Macedonians | 99.8 /100 | #44 | Exceptional 16.5% |
| Immigrants | Europe | 99.8 /100 | #45 | Exceptional 16.5% |
| Immigrants | Colombia | 99.8 /100 | #46 | Exceptional 16.5% |
| Immigrants | Italy | 99.8 /100 | #47 | Exceptional 16.5% |
| Immigrants | North America | 99.8 /100 | #48 | Exceptional 16.5% |
| Iranians | 99.8 /100 | #49 | Exceptional 16.5% |
| Norwegians | 99.8 /100 | #50 | Exceptional 16.5% |
| Immigrants | Korea | 99.8 /100 | #51 | Exceptional 16.5% |
| Soviet Union | 99.8 /100 | #52 | Exceptional 16.5% |
| Swedes | 99.8 /100 | #53 | Exceptional 16.5% |
| Immigrants | Iran | 99.8 /100 | #54 | Exceptional 16.5% |
| Immigrants | Venezuela | 99.7 /100 | #55 | Exceptional 16.5% |
| Austrians | 99.7 /100 | #56 | Exceptional 16.6% |
| Bhutanese | 99.7 /100 | #57 | Exceptional 16.6% |
| Pennsylvania Germans | 99.7 /100 | #58 | Exceptional 16.6% |
Demographics Similar to Inupiat by Cognitive Disability
In terms of cognitive disability, the demographic groups most similar to Inupiat are Immigrants from Japan (16.9%, a difference of 0.050%), Immigrants from Denmark (16.9%, a difference of 0.060%), Yup'ik (16.9%, a difference of 0.10%), Immigrants from Sri Lanka (16.8%, a difference of 0.15%), and Korean (16.8%, a difference of 0.15%).
| Demographics | Rating | Rank | Cognitive Disability |
| Albanians | 97.3 /100 | #109 | Exceptional 16.8% |
| Arapaho | 97.3 /100 | #110 | Exceptional 16.8% |
| Uruguayans | 97.2 /100 | #111 | Exceptional 16.8% |
| Indians (Asian) | 97.2 /100 | #112 | Exceptional 16.8% |
| Immigrants | Sri Lanka | 97.1 /100 | #113 | Exceptional 16.8% |
| Koreans | 97.1 /100 | #114 | Exceptional 16.8% |
| Yup'ik | 96.9 /100 | #115 | Exceptional 16.9% |
| Inupiat | 96.5 /100 | #116 | Exceptional 16.9% |
| Immigrants | Japan | 96.2 /100 | #117 | Exceptional 16.9% |
| Immigrants | Denmark | 96.2 /100 | #118 | Exceptional 16.9% |
| South Africans | 95.5 /100 | #119 | Exceptional 16.9% |
| Scottish | 95.0 /100 | #120 | Exceptional 16.9% |
| Immigrants | China | 94.9 /100 | #121 | Exceptional 16.9% |
| Immigrants | Western Europe | 94.8 /100 | #122 | Exceptional 16.9% |
| Portuguese | 94.7 /100 | #123 | Exceptional 16.9% |