Immigrants from Korea vs Immigrants from Sudan Disability
COMPARE
Immigrants from Korea
Immigrants from Sudan
Disability
Disability Comparison
Immigrants from Korea
Immigrants from Sudan
10.2%
DISABILITY
100.0/ 100
METRIC RATING
14th/ 347
METRIC RANK
11.5%
DISABILITY
85.3/ 100
METRIC RATING
142nd/ 347
METRIC RANK
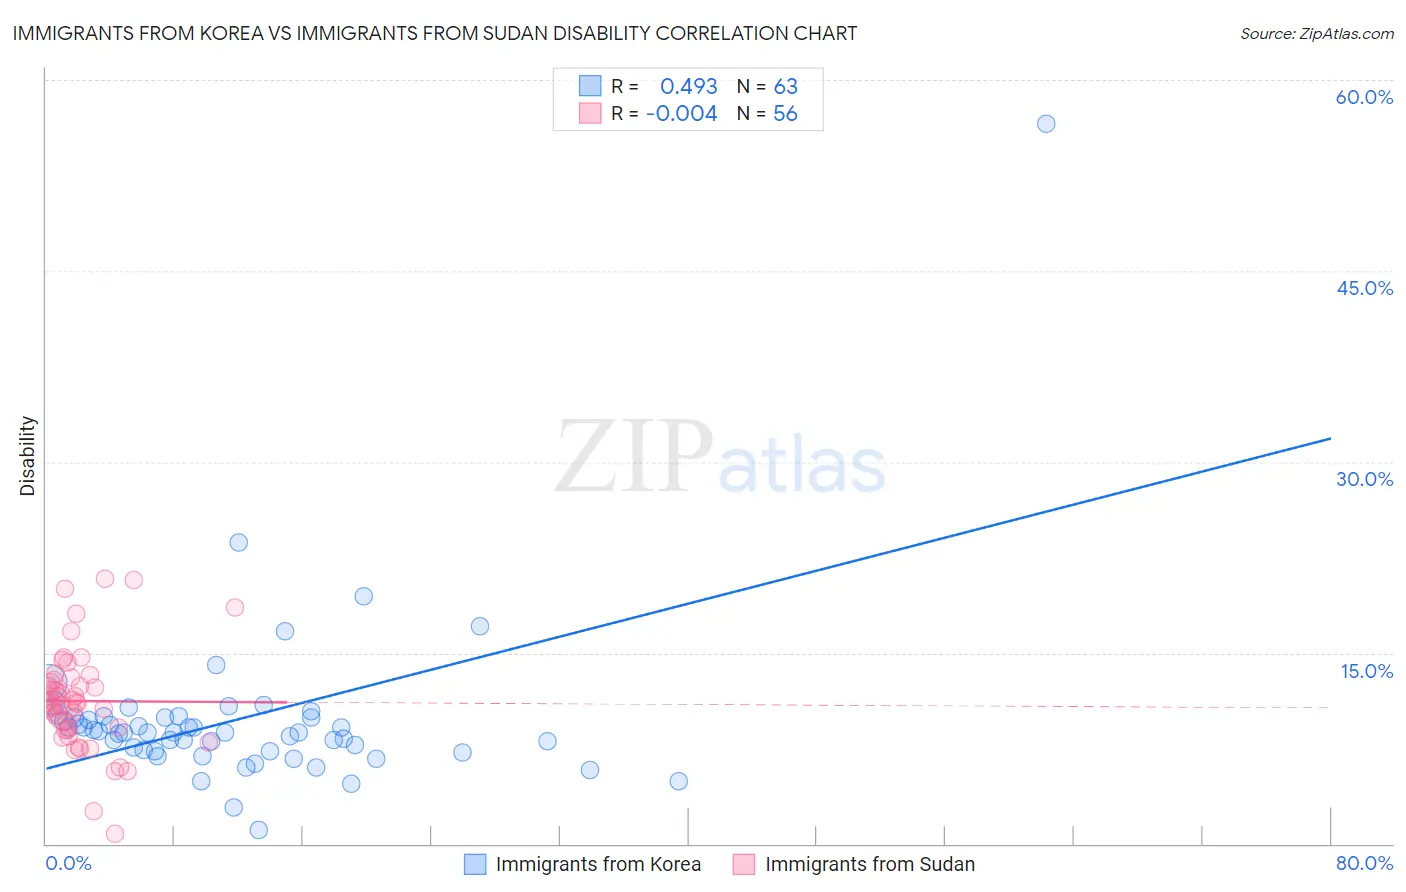
Immigrants from Korea vs Immigrants from Sudan Disability Correlation Chart
The statistical analysis conducted on geographies consisting of 416,299,820 people shows a moderate positive correlation between the proportion of Immigrants from Korea and percentage of population with a disability in the United States with a correlation coefficient (R) of 0.493 and weighted average of 10.2%. Similarly, the statistical analysis conducted on geographies consisting of 118,962,854 people shows no correlation between the proportion of Immigrants from Sudan and percentage of population with a disability in the United States with a correlation coefficient (R) of -0.004 and weighted average of 11.5%, a difference of 12.2%.
Disability Correlation Summary
| Measurement | Immigrants from Korea | Immigrants from Sudan |
| Minimum | 1.1% | 0.75% |
| Maximum | 56.6% | 20.9% |
| Range | 55.5% | 20.1% |
| Mean | 9.8% | 11.2% |
| Median | 8.8% | 11.0% |
| Interquartile 25% (IQ1) | 7.3% | 9.0% |
| Interquartile 75% (IQ3) | 9.9% | 12.8% |
| Interquartile Range (IQR) | 2.6% | 3.8% |
| Standard Deviation (Sample) | 6.9% | 3.9% |
| Standard Deviation (Population) | 6.9% | 3.9% |
Similar Demographics by Disability
Demographics Similar to Immigrants from Korea by Disability
In terms of disability, the demographic groups most similar to Immigrants from Korea are Okinawan (10.3%, a difference of 0.31%), Indian (Asian) (10.3%, a difference of 0.37%), Immigrants from Iran (10.3%, a difference of 0.44%), Immigrants from Eastern Asia (10.2%, a difference of 0.60%), and Immigrants from Israel (10.1%, a difference of 0.81%).
| Demographics | Rating | Rank | Disability |
| Immigrants | Singapore | 100.0 /100 | #7 | Exceptional 10.0% |
| Bolivians | 100.0 /100 | #8 | Exceptional 10.0% |
| Immigrants | Hong Kong | 100.0 /100 | #9 | Exceptional 10.0% |
| Immigrants | China | 100.0 /100 | #10 | Exceptional 10.1% |
| Iranians | 100.0 /100 | #11 | Exceptional 10.1% |
| Immigrants | Israel | 100.0 /100 | #12 | Exceptional 10.1% |
| Immigrants | Eastern Asia | 100.0 /100 | #13 | Exceptional 10.2% |
| Immigrants | Korea | 100.0 /100 | #14 | Exceptional 10.2% |
| Okinawans | 100.0 /100 | #15 | Exceptional 10.3% |
| Indians (Asian) | 100.0 /100 | #16 | Exceptional 10.3% |
| Immigrants | Iran | 100.0 /100 | #17 | Exceptional 10.3% |
| Burmese | 100.0 /100 | #18 | Exceptional 10.4% |
| Immigrants | Pakistan | 100.0 /100 | #19 | Exceptional 10.4% |
| Immigrants | Venezuela | 100.0 /100 | #20 | Exceptional 10.4% |
| Asians | 100.0 /100 | #21 | Exceptional 10.4% |
Demographics Similar to Immigrants from Sudan by Disability
In terms of disability, the demographic groups most similar to Immigrants from Sudan are Immigrants from Grenada (11.5%, a difference of 0.070%), Russian (11.5%, a difference of 0.14%), New Zealander (11.5%, a difference of 0.16%), Ghanaian (11.5%, a difference of 0.16%), and Kenyan (11.5%, a difference of 0.17%).
| Demographics | Rating | Rank | Disability |
| Ugandans | 87.9 /100 | #135 | Excellent 11.4% |
| Immigrants | St. Vincent and the Grenadines | 87.8 /100 | #136 | Excellent 11.4% |
| Kenyans | 87.1 /100 | #137 | Excellent 11.5% |
| New Zealanders | 87.0 /100 | #138 | Excellent 11.5% |
| Ghanaians | 87.0 /100 | #139 | Excellent 11.5% |
| Russians | 86.8 /100 | #140 | Excellent 11.5% |
| Immigrants | Grenada | 86.1 /100 | #141 | Excellent 11.5% |
| Immigrants | Sudan | 85.3 /100 | #142 | Excellent 11.5% |
| Moroccans | 83.3 /100 | #143 | Excellent 11.5% |
| Australians | 82.5 /100 | #144 | Excellent 11.5% |
| Nigerians | 81.3 /100 | #145 | Excellent 11.5% |
| Immigrants | Hungary | 79.0 /100 | #146 | Good 11.5% |
| Immigrants | Ukraine | 77.6 /100 | #147 | Good 11.5% |
| Sudanese | 77.1 /100 | #148 | Good 11.5% |
| Immigrants | Norway | 73.2 /100 | #149 | Good 11.6% |