Immigrants from Korea vs Dutch Disability
COMPARE
Immigrants from Korea
Dutch
Disability
Disability Comparison
Immigrants from Korea
Dutch
10.2%
DISABILITY
100.0/ 100
METRIC RATING
14th/ 347
METRIC RANK
12.8%
DISABILITY
0.0/ 100
METRIC RATING
277th/ 347
METRIC RANK
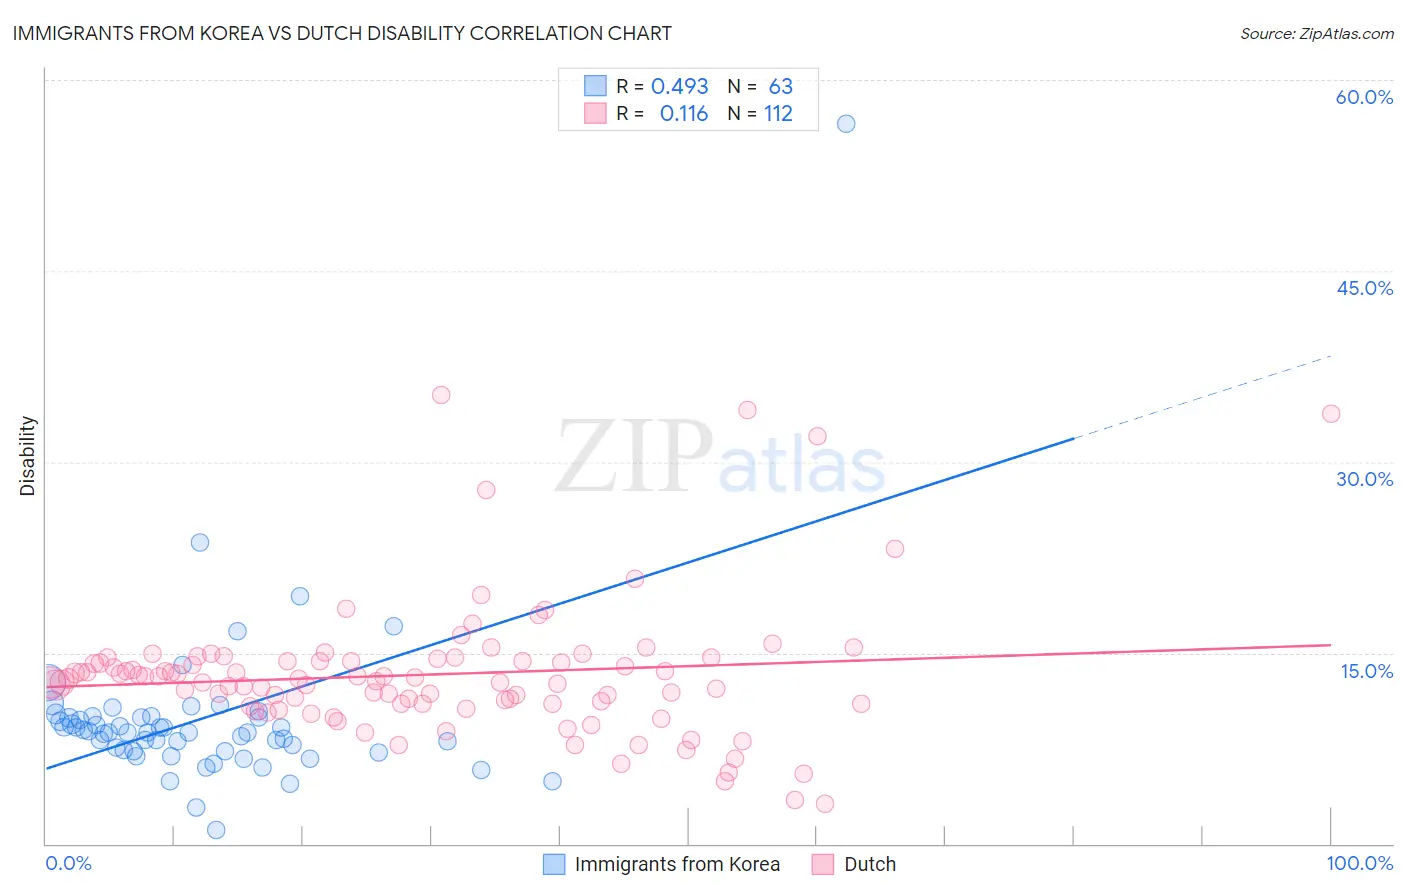
Immigrants from Korea vs Dutch Disability Correlation Chart
The statistical analysis conducted on geographies consisting of 416,299,820 people shows a moderate positive correlation between the proportion of Immigrants from Korea and percentage of population with a disability in the United States with a correlation coefficient (R) of 0.493 and weighted average of 10.2%. Similarly, the statistical analysis conducted on geographies consisting of 554,259,467 people shows a poor positive correlation between the proportion of Dutch and percentage of population with a disability in the United States with a correlation coefficient (R) of 0.116 and weighted average of 12.8%, a difference of 25.3%.
Disability Correlation Summary
| Measurement | Immigrants from Korea | Dutch |
| Minimum | 1.1% | 3.1% |
| Maximum | 56.6% | 35.3% |
| Range | 55.5% | 32.1% |
| Mean | 9.8% | 13.3% |
| Median | 8.8% | 12.8% |
| Interquartile 25% (IQ1) | 7.3% | 11.0% |
| Interquartile 75% (IQ3) | 9.9% | 14.4% |
| Interquartile Range (IQR) | 2.6% | 3.3% |
| Standard Deviation (Sample) | 6.9% | 5.3% |
| Standard Deviation (Population) | 6.9% | 5.3% |
Similar Demographics by Disability
Demographics Similar to Immigrants from Korea by Disability
In terms of disability, the demographic groups most similar to Immigrants from Korea are Okinawan (10.3%, a difference of 0.31%), Indian (Asian) (10.3%, a difference of 0.37%), Immigrants from Iran (10.3%, a difference of 0.44%), Immigrants from Eastern Asia (10.2%, a difference of 0.60%), and Immigrants from Israel (10.1%, a difference of 0.81%).
| Demographics | Rating | Rank | Disability |
| Immigrants | Singapore | 100.0 /100 | #7 | Exceptional 10.0% |
| Bolivians | 100.0 /100 | #8 | Exceptional 10.0% |
| Immigrants | Hong Kong | 100.0 /100 | #9 | Exceptional 10.0% |
| Immigrants | China | 100.0 /100 | #10 | Exceptional 10.1% |
| Iranians | 100.0 /100 | #11 | Exceptional 10.1% |
| Immigrants | Israel | 100.0 /100 | #12 | Exceptional 10.1% |
| Immigrants | Eastern Asia | 100.0 /100 | #13 | Exceptional 10.2% |
| Immigrants | Korea | 100.0 /100 | #14 | Exceptional 10.2% |
| Okinawans | 100.0 /100 | #15 | Exceptional 10.3% |
| Indians (Asian) | 100.0 /100 | #16 | Exceptional 10.3% |
| Immigrants | Iran | 100.0 /100 | #17 | Exceptional 10.3% |
| Burmese | 100.0 /100 | #18 | Exceptional 10.4% |
| Immigrants | Pakistan | 100.0 /100 | #19 | Exceptional 10.4% |
| Immigrants | Venezuela | 100.0 /100 | #20 | Exceptional 10.4% |
| Asians | 100.0 /100 | #21 | Exceptional 10.4% |
Demographics Similar to Dutch by Disability
In terms of disability, the demographic groups most similar to Dutch are Hmong (12.8%, a difference of 0.050%), German (12.8%, a difference of 0.17%), Sioux (12.8%, a difference of 0.20%), Fijian (12.8%, a difference of 0.26%), and Nepalese (12.8%, a difference of 0.28%).
| Demographics | Rating | Rank | Disability |
| Portuguese | 0.1 /100 | #270 | Tragic 12.6% |
| Immigrants | Yemen | 0.1 /100 | #271 | Tragic 12.6% |
| Dominicans | 0.0 /100 | #272 | Tragic 12.7% |
| Finns | 0.0 /100 | #273 | Tragic 12.7% |
| Nepalese | 0.0 /100 | #274 | Tragic 12.8% |
| Sioux | 0.0 /100 | #275 | Tragic 12.8% |
| Hmong | 0.0 /100 | #276 | Tragic 12.8% |
| Dutch | 0.0 /100 | #277 | Tragic 12.8% |
| Germans | 0.0 /100 | #278 | Tragic 12.8% |
| Fijians | 0.0 /100 | #279 | Tragic 12.8% |
| Spanish | 0.0 /100 | #280 | Tragic 12.8% |
| Immigrants | Portugal | 0.0 /100 | #281 | Tragic 12.9% |
| Scottish | 0.0 /100 | #282 | Tragic 12.9% |
| Irish | 0.0 /100 | #283 | Tragic 12.9% |
| Welsh | 0.0 /100 | #284 | Tragic 12.9% |