Immigrants from Jordan vs Spanish American Indian Disability Age Under 5
COMPARE
Immigrants from Jordan
Spanish American Indian
Disability Age Under 5
Disability Age Under 5 Comparison
Immigrants from Jordan
Spanish American Indians
1.1%
DISABILITY AGE UNDER 5
97.9/ 100
METRIC RATING
82nd/ 347
METRIC RANK
1.3%
DISABILITY AGE UNDER 5
2.4/ 100
METRIC RATING
238th/ 347
METRIC RANK
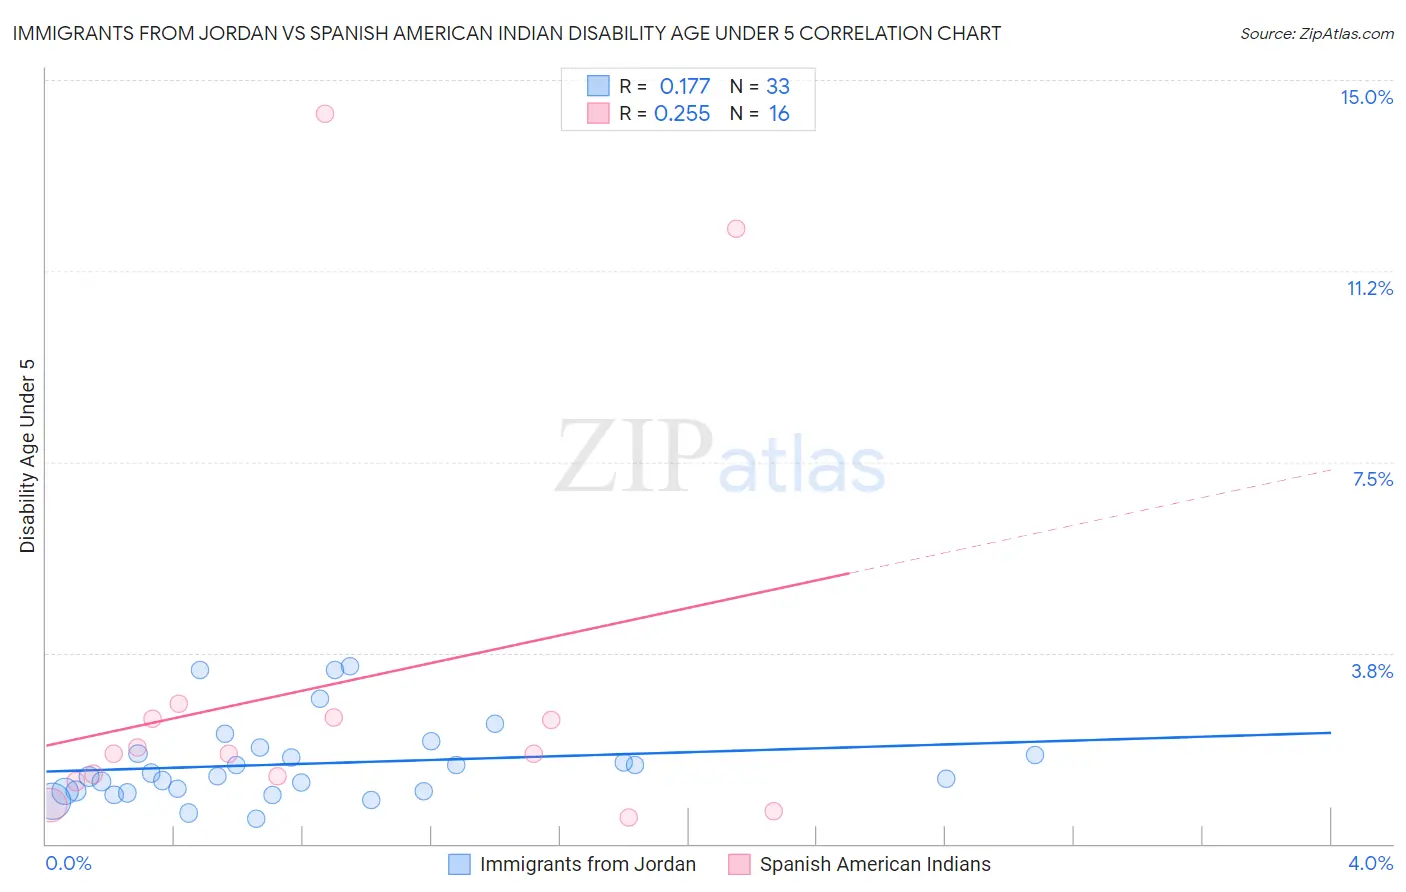
Immigrants from Jordan vs Spanish American Indian Disability Age Under 5 Correlation Chart
The statistical analysis conducted on geographies consisting of 123,224,652 people shows a poor positive correlation between the proportion of Immigrants from Jordan and percentage of population with a disability under the age of 5 in the United States with a correlation coefficient (R) of 0.177 and weighted average of 1.1%. Similarly, the statistical analysis conducted on geographies consisting of 62,046,351 people shows a weak positive correlation between the proportion of Spanish American Indians and percentage of population with a disability under the age of 5 in the United States with a correlation coefficient (R) of 0.255 and weighted average of 1.3%, a difference of 18.6%.
Disability Age Under 5 Correlation Summary
| Measurement | Immigrants from Jordan | Spanish American Indian |
| Minimum | 0.48% | 0.53% |
| Maximum | 3.5% | 14.3% |
| Range | 3.0% | 13.8% |
| Mean | 1.6% | 3.1% |
| Median | 1.3% | 1.8% |
| Interquartile 25% (IQ1) | 1.0% | 1.3% |
| Interquartile 75% (IQ3) | 1.8% | 2.5% |
| Interquartile Range (IQR) | 0.80% | 1.2% |
| Standard Deviation (Sample) | 0.78% | 4.0% |
| Standard Deviation (Population) | 0.76% | 3.9% |
Similar Demographics by Disability Age Under 5
Demographics Similar to Immigrants from Jordan by Disability Age Under 5
In terms of disability age under 5, the demographic groups most similar to Immigrants from Jordan are Immigrants from Syria (1.1%, a difference of 0.010%), Turkish (1.1%, a difference of 0.11%), Immigrants from Trinidad and Tobago (1.1%, a difference of 0.13%), Hmong (1.1%, a difference of 0.16%), and Immigrants from Zaire (1.1%, a difference of 0.16%).
| Demographics | Rating | Rank | Disability Age Under 5 |
| Immigrants | Pakistan | 98.4 /100 | #75 | Exceptional 1.1% |
| Immigrants | Burma/Myanmar | 98.2 /100 | #76 | Exceptional 1.1% |
| Immigrants | Denmark | 98.1 /100 | #77 | Exceptional 1.1% |
| West Indians | 98.0 /100 | #78 | Exceptional 1.1% |
| Hmong | 98.0 /100 | #79 | Exceptional 1.1% |
| Immigrants | Trinidad and Tobago | 98.0 /100 | #80 | Exceptional 1.1% |
| Turks | 98.0 /100 | #81 | Exceptional 1.1% |
| Immigrants | Jordan | 97.9 /100 | #82 | Exceptional 1.1% |
| Immigrants | Syria | 97.9 /100 | #83 | Exceptional 1.1% |
| Immigrants | Zaire | 97.8 /100 | #84 | Exceptional 1.1% |
| Sudanese | 97.7 /100 | #85 | Exceptional 1.1% |
| Okinawans | 97.6 /100 | #86 | Exceptional 1.1% |
| Ugandans | 97.5 /100 | #87 | Exceptional 1.1% |
| Immigrants | Dominican Republic | 97.5 /100 | #88 | Exceptional 1.1% |
| Ethiopians | 97.2 /100 | #89 | Exceptional 1.1% |
Demographics Similar to Spanish American Indians by Disability Age Under 5
In terms of disability age under 5, the demographic groups most similar to Spanish American Indians are Immigrants from Austria (1.3%, a difference of 0.16%), Native Hawaiian (1.3%, a difference of 0.18%), Maltese (1.3%, a difference of 0.25%), Lumbee (1.3%, a difference of 0.34%), and Basque (1.3%, a difference of 0.43%).
| Demographics | Rating | Rank | Disability Age Under 5 |
| Immigrants | Northern Europe | 4.7 /100 | #231 | Tragic 1.3% |
| French American Indians | 4.5 /100 | #232 | Tragic 1.3% |
| Tongans | 4.2 /100 | #233 | Tragic 1.3% |
| Pueblo | 3.8 /100 | #234 | Tragic 1.3% |
| Central American Indians | 3.6 /100 | #235 | Tragic 1.3% |
| South American Indians | 3.3 /100 | #236 | Tragic 1.3% |
| Basques | 3.0 /100 | #237 | Tragic 1.3% |
| Spanish American Indians | 2.4 /100 | #238 | Tragic 1.3% |
| Immigrants | Austria | 2.3 /100 | #239 | Tragic 1.3% |
| Native Hawaiians | 2.2 /100 | #240 | Tragic 1.3% |
| Maltese | 2.2 /100 | #241 | Tragic 1.3% |
| Lumbee | 2.1 /100 | #242 | Tragic 1.3% |
| Immigrants | Cameroon | 1.7 /100 | #243 | Tragic 1.4% |
| Spaniards | 1.4 /100 | #244 | Tragic 1.4% |
| Potawatomi | 1.1 /100 | #245 | Tragic 1.4% |