Immigrants from Jordan vs Immigrants from Latvia Disability Age Under 5
COMPARE
Immigrants from Jordan
Immigrants from Latvia
Disability Age Under 5
Disability Age Under 5 Comparison
Immigrants from Jordan
Immigrants from Latvia
1.1%
DISABILITY AGE UNDER 5
97.9/ 100
METRIC RATING
82nd/ 347
METRIC RANK
1.2%
DISABILITY AGE UNDER 5
50.0/ 100
METRIC RATING
174th/ 347
METRIC RANK
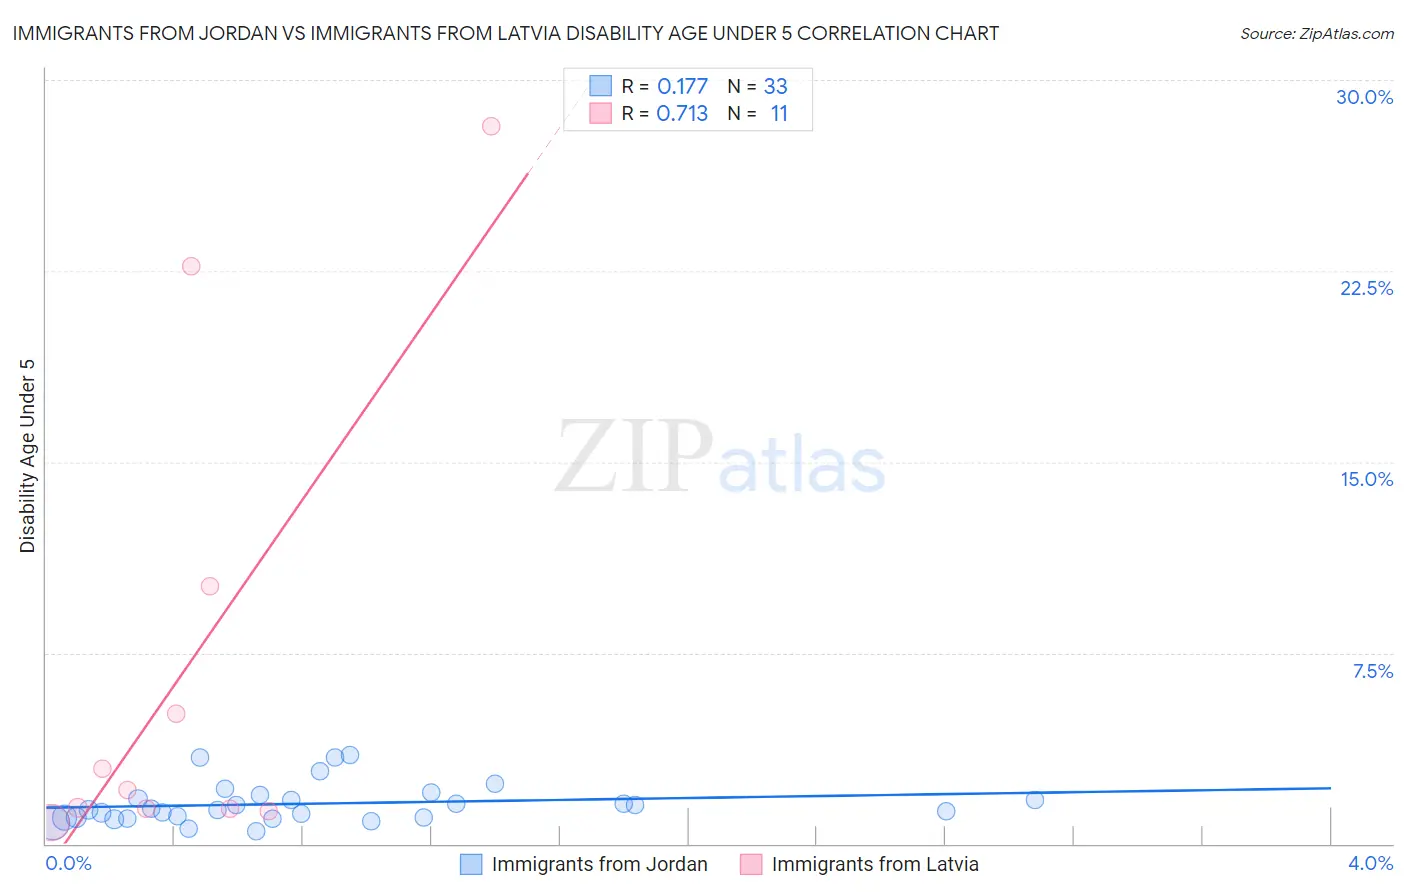
Immigrants from Jordan vs Immigrants from Latvia Disability Age Under 5 Correlation Chart
The statistical analysis conducted on geographies consisting of 123,224,652 people shows a poor positive correlation between the proportion of Immigrants from Jordan and percentage of population with a disability under the age of 5 in the United States with a correlation coefficient (R) of 0.177 and weighted average of 1.1%. Similarly, the statistical analysis conducted on geographies consisting of 82,600,960 people shows a strong positive correlation between the proportion of Immigrants from Latvia and percentage of population with a disability under the age of 5 in the United States with a correlation coefficient (R) of 0.713 and weighted average of 1.2%, a difference of 9.5%.
Disability Age Under 5 Correlation Summary
| Measurement | Immigrants from Jordan | Immigrants from Latvia |
| Minimum | 0.48% | 0.83% |
| Maximum | 3.5% | 28.2% |
| Range | 3.0% | 27.3% |
| Mean | 1.6% | 7.0% |
| Median | 1.3% | 2.1% |
| Interquartile 25% (IQ1) | 1.0% | 1.4% |
| Interquartile 75% (IQ3) | 1.8% | 10.1% |
| Interquartile Range (IQR) | 0.80% | 8.8% |
| Standard Deviation (Sample) | 0.78% | 9.6% |
| Standard Deviation (Population) | 0.76% | 9.1% |
Similar Demographics by Disability Age Under 5
Demographics Similar to Immigrants from Jordan by Disability Age Under 5
In terms of disability age under 5, the demographic groups most similar to Immigrants from Jordan are Immigrants from Syria (1.1%, a difference of 0.010%), Turkish (1.1%, a difference of 0.11%), Immigrants from Trinidad and Tobago (1.1%, a difference of 0.13%), Hmong (1.1%, a difference of 0.16%), and Immigrants from Zaire (1.1%, a difference of 0.16%).
| Demographics | Rating | Rank | Disability Age Under 5 |
| Immigrants | Pakistan | 98.4 /100 | #75 | Exceptional 1.1% |
| Immigrants | Burma/Myanmar | 98.2 /100 | #76 | Exceptional 1.1% |
| Immigrants | Denmark | 98.1 /100 | #77 | Exceptional 1.1% |
| West Indians | 98.0 /100 | #78 | Exceptional 1.1% |
| Hmong | 98.0 /100 | #79 | Exceptional 1.1% |
| Immigrants | Trinidad and Tobago | 98.0 /100 | #80 | Exceptional 1.1% |
| Turks | 98.0 /100 | #81 | Exceptional 1.1% |
| Immigrants | Jordan | 97.9 /100 | #82 | Exceptional 1.1% |
| Immigrants | Syria | 97.9 /100 | #83 | Exceptional 1.1% |
| Immigrants | Zaire | 97.8 /100 | #84 | Exceptional 1.1% |
| Sudanese | 97.7 /100 | #85 | Exceptional 1.1% |
| Okinawans | 97.6 /100 | #86 | Exceptional 1.1% |
| Ugandans | 97.5 /100 | #87 | Exceptional 1.1% |
| Immigrants | Dominican Republic | 97.5 /100 | #88 | Exceptional 1.1% |
| Ethiopians | 97.2 /100 | #89 | Exceptional 1.1% |
Demographics Similar to Immigrants from Latvia by Disability Age Under 5
In terms of disability age under 5, the demographic groups most similar to Immigrants from Latvia are Immigrants from Nigeria (1.2%, a difference of 0.0%), Immigrants from Ireland (1.2%, a difference of 0.020%), Crow (1.2%, a difference of 0.090%), Immigrants from Kenya (1.2%, a difference of 0.13%), and Comanche (1.2%, a difference of 0.22%).
| Demographics | Rating | Rank | Disability Age Under 5 |
| Immigrants | Argentina | 60.2 /100 | #167 | Good 1.2% |
| Sierra Leoneans | 59.1 /100 | #168 | Average 1.2% |
| Immigrants | Uruguay | 59.0 /100 | #169 | Average 1.2% |
| Immigrants | Jamaica | 58.8 /100 | #170 | Average 1.2% |
| Guamanians/Chamorros | 57.8 /100 | #171 | Average 1.2% |
| Crow | 51.0 /100 | #172 | Average 1.2% |
| Immigrants | Ireland | 50.3 /100 | #173 | Average 1.2% |
| Immigrants | Latvia | 50.0 /100 | #174 | Average 1.2% |
| Immigrants | Nigeria | 50.0 /100 | #175 | Average 1.2% |
| Immigrants | Kenya | 48.6 /100 | #176 | Average 1.2% |
| Comanche | 47.5 /100 | #177 | Average 1.2% |
| Venezuelans | 47.1 /100 | #178 | Average 1.2% |
| Immigrants | Bahamas | 45.2 /100 | #179 | Average 1.2% |
| Immigrants | Mexico | 44.4 /100 | #180 | Average 1.2% |
| Immigrants | Peru | 43.7 /100 | #181 | Average 1.2% |
| Macedonians | 43.7 /100 | #181 | Average 1.2% |