Immigrants from Japan vs Japanese Male Disability
COMPARE
Immigrants from Japan
Japanese
Male Disability
Male Disability Comparison
Immigrants from Japan
Japanese
10.4%
MALE DISABILITY
99.5/ 100
METRIC RATING
58th/ 347
METRIC RANK
11.7%
MALE DISABILITY
3.1/ 100
METRIC RATING
224th/ 347
METRIC RANK
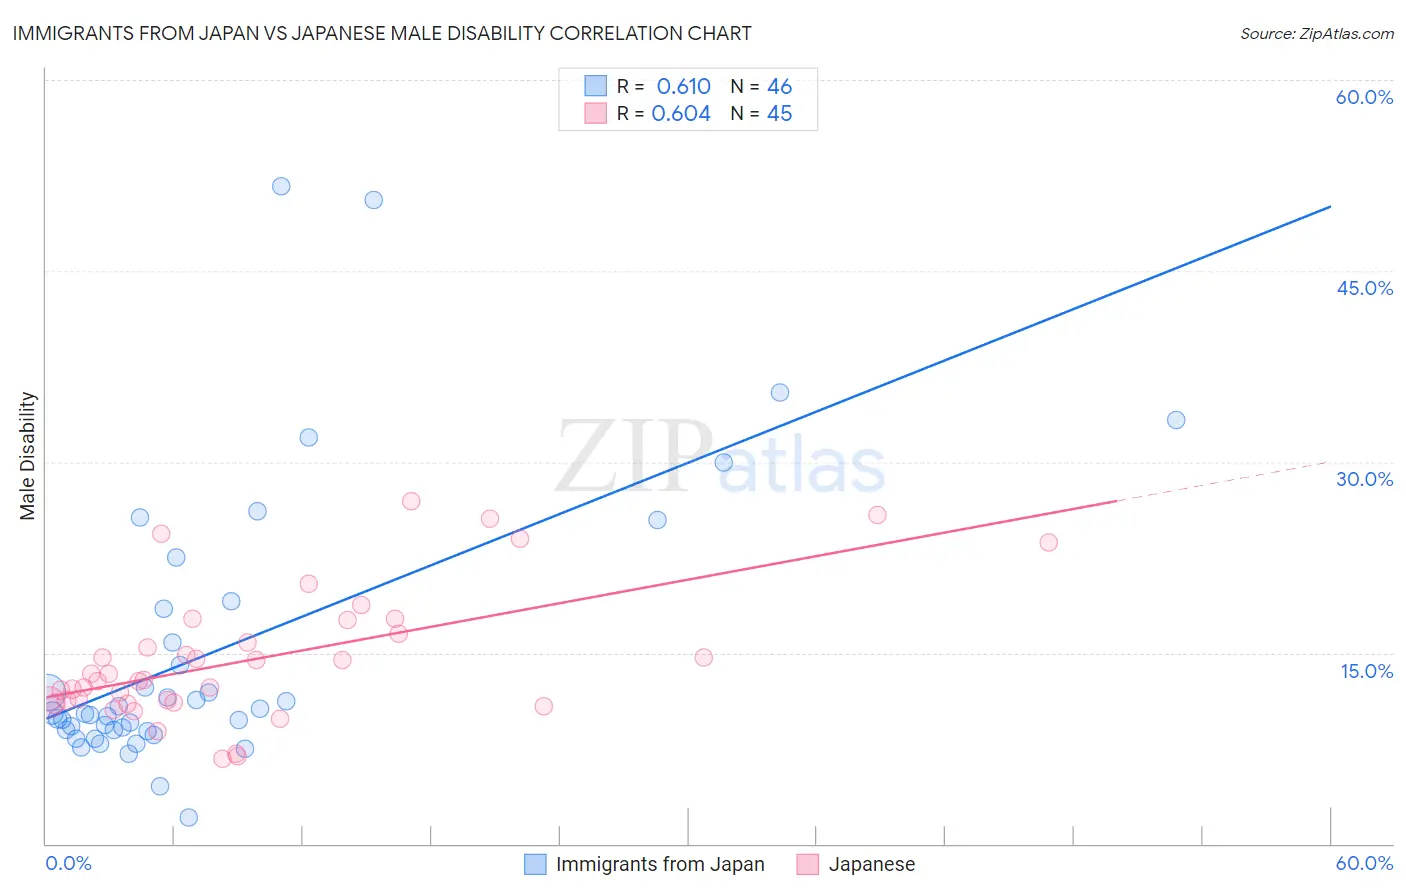
Immigrants from Japan vs Japanese Male Disability Correlation Chart
The statistical analysis conducted on geographies consisting of 340,135,143 people shows a significant positive correlation between the proportion of Immigrants from Japan and percentage of males with a disability in the United States with a correlation coefficient (R) of 0.610 and weighted average of 10.4%. Similarly, the statistical analysis conducted on geographies consisting of 249,159,975 people shows a significant positive correlation between the proportion of Japanese and percentage of males with a disability in the United States with a correlation coefficient (R) of 0.604 and weighted average of 11.7%, a difference of 13.2%.
Male Disability Correlation Summary
| Measurement | Immigrants from Japan | Japanese |
| Minimum | 2.1% | 6.7% |
| Maximum | 51.6% | 26.9% |
| Range | 49.5% | 20.2% |
| Mean | 15.1% | 14.5% |
| Median | 10.2% | 12.9% |
| Interquartile 25% (IQ1) | 8.9% | 11.1% |
| Interquartile 75% (IQ3) | 18.5% | 17.0% |
| Interquartile Range (IQR) | 9.6% | 5.9% |
| Standard Deviation (Sample) | 11.1% | 5.1% |
| Standard Deviation (Population) | 11.0% | 5.1% |
Similar Demographics by Male Disability
Demographics Similar to Immigrants from Japan by Male Disability
In terms of male disability, the demographic groups most similar to Immigrants from Japan are Immigrants from South America (10.4%, a difference of 0.070%), Tongan (10.4%, a difference of 0.10%), Immigrants from Eritrea (10.4%, a difference of 0.14%), Immigrants from Australia (10.4%, a difference of 0.14%), and Peruvian (10.4%, a difference of 0.15%).
| Demographics | Rating | Rank | Male Disability |
| Salvadorans | 99.6 /100 | #51 | Exceptional 10.4% |
| Immigrants | Saudi Arabia | 99.6 /100 | #52 | Exceptional 10.4% |
| Immigrants | Uzbekistan | 99.6 /100 | #53 | Exceptional 10.4% |
| Peruvians | 99.6 /100 | #54 | Exceptional 10.4% |
| Immigrants | Eritrea | 99.6 /100 | #55 | Exceptional 10.4% |
| Tongans | 99.6 /100 | #56 | Exceptional 10.4% |
| Immigrants | South America | 99.6 /100 | #57 | Exceptional 10.4% |
| Immigrants | Japan | 99.5 /100 | #58 | Exceptional 10.4% |
| Immigrants | Australia | 99.5 /100 | #59 | Exceptional 10.4% |
| Immigrants | Colombia | 99.5 /100 | #60 | Exceptional 10.4% |
| Immigrants | Northern Africa | 99.4 /100 | #61 | Exceptional 10.4% |
| Immigrants | Ecuador | 99.3 /100 | #62 | Exceptional 10.4% |
| Immigrants | Belarus | 99.3 /100 | #63 | Exceptional 10.4% |
| Jordanians | 99.3 /100 | #64 | Exceptional 10.5% |
| Immigrants | Grenada | 99.2 /100 | #65 | Exceptional 10.5% |
Demographics Similar to Japanese by Male Disability
In terms of male disability, the demographic groups most similar to Japanese are Liberian (11.8%, a difference of 0.010%), Immigrants from Bahamas (11.7%, a difference of 0.020%), Alsatian (11.7%, a difference of 0.11%), Subsaharan African (11.8%, a difference of 0.13%), and Immigrants from Congo (11.7%, a difference of 0.26%).
| Demographics | Rating | Rank | Male Disability |
| Immigrants | Dominica | 4.6 /100 | #217 | Tragic 11.7% |
| Immigrants | England | 4.0 /100 | #218 | Tragic 11.7% |
| Panamanians | 3.8 /100 | #219 | Tragic 11.7% |
| Immigrants | Western Europe | 3.8 /100 | #220 | Tragic 11.7% |
| Immigrants | Congo | 3.7 /100 | #221 | Tragic 11.7% |
| Alsatians | 3.3 /100 | #222 | Tragic 11.7% |
| Immigrants | Bahamas | 3.2 /100 | #223 | Tragic 11.7% |
| Japanese | 3.1 /100 | #224 | Tragic 11.7% |
| Liberians | 3.1 /100 | #225 | Tragic 11.8% |
| Sub-Saharan Africans | 2.8 /100 | #226 | Tragic 11.8% |
| Austrians | 2.5 /100 | #227 | Tragic 11.8% |
| Hispanics or Latinos | 2.3 /100 | #228 | Tragic 11.8% |
| Bermudans | 2.3 /100 | #229 | Tragic 11.8% |
| Croatians | 2.1 /100 | #230 | Tragic 11.8% |
| Dominicans | 1.8 /100 | #231 | Tragic 11.8% |