Immigrants from Japan vs Turkish Male Disability
COMPARE
Immigrants from Japan
Turkish
Male Disability
Male Disability Comparison
Immigrants from Japan
Turks
10.4%
MALE DISABILITY
99.5/ 100
METRIC RATING
58th/ 347
METRIC RANK
10.3%
MALE DISABILITY
99.7/ 100
METRIC RATING
45th/ 347
METRIC RANK
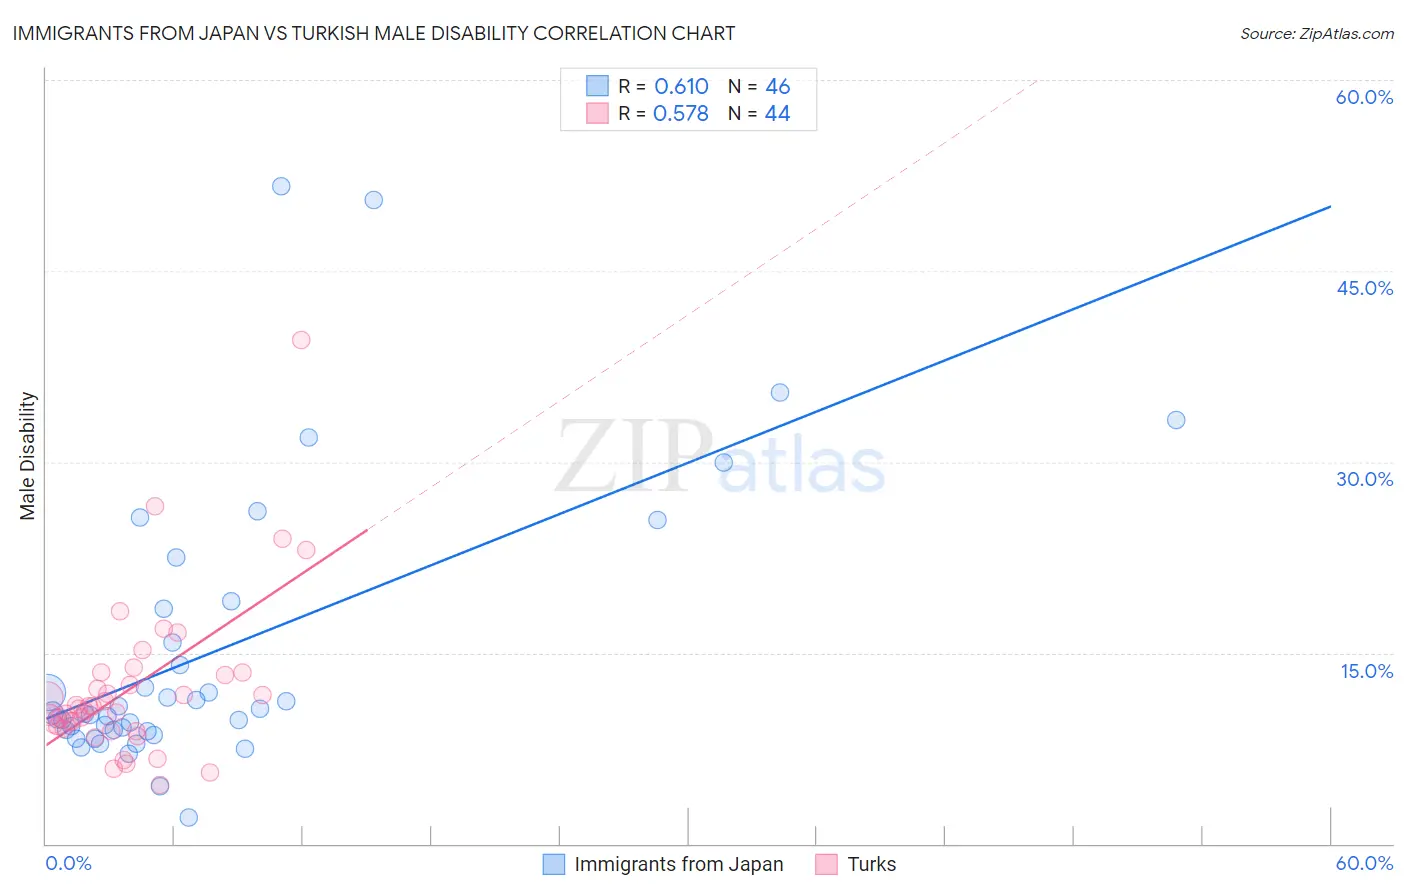
Immigrants from Japan vs Turkish Male Disability Correlation Chart
The statistical analysis conducted on geographies consisting of 340,135,143 people shows a significant positive correlation between the proportion of Immigrants from Japan and percentage of males with a disability in the United States with a correlation coefficient (R) of 0.610 and weighted average of 10.4%. Similarly, the statistical analysis conducted on geographies consisting of 271,851,914 people shows a substantial positive correlation between the proportion of Turks and percentage of males with a disability in the United States with a correlation coefficient (R) of 0.578 and weighted average of 10.3%, a difference of 0.77%.
Male Disability Correlation Summary
| Measurement | Immigrants from Japan | Turkish |
| Minimum | 2.1% | 4.6% |
| Maximum | 51.6% | 39.6% |
| Range | 49.5% | 34.9% |
| Mean | 15.1% | 12.2% |
| Median | 10.2% | 10.7% |
| Interquartile 25% (IQ1) | 8.9% | 9.1% |
| Interquartile 75% (IQ3) | 18.5% | 13.3% |
| Interquartile Range (IQR) | 9.6% | 4.2% |
| Standard Deviation (Sample) | 11.1% | 6.2% |
| Standard Deviation (Population) | 11.0% | 6.2% |
Demographics Similar to Immigrants from Japan and Turks by Male Disability
In terms of male disability, the demographic groups most similar to Immigrants from Japan are Immigrants from South America (10.4%, a difference of 0.070%), Tongan (10.4%, a difference of 0.10%), Immigrants from Eritrea (10.4%, a difference of 0.14%), Immigrants from Australia (10.4%, a difference of 0.14%), and Peruvian (10.4%, a difference of 0.15%). Similarly, the demographic groups most similar to Turks are Immigrants from El Salvador (10.3%, a difference of 0.0%), Immigrants from Bangladesh (10.3%, a difference of 0.080%), Cambodian (10.3%, a difference of 0.080%), Mongolian (10.3%, a difference of 0.10%), and Immigrants from Peru (10.3%, a difference of 0.12%).
| Demographics | Rating | Rank | Male Disability |
| Taiwanese | 99.8 /100 | #41 | Exceptional 10.3% |
| Mongolians | 99.7 /100 | #42 | Exceptional 10.3% |
| Immigrants | Bangladesh | 99.7 /100 | #43 | Exceptional 10.3% |
| Immigrants | El Salvador | 99.7 /100 | #44 | Exceptional 10.3% |
| Turks | 99.7 /100 | #45 | Exceptional 10.3% |
| Cambodians | 99.7 /100 | #46 | Exceptional 10.3% |
| Immigrants | Peru | 99.7 /100 | #47 | Exceptional 10.3% |
| Israelis | 99.7 /100 | #48 | Exceptional 10.3% |
| Immigrants | Spain | 99.7 /100 | #49 | Exceptional 10.3% |
| South Americans | 99.6 /100 | #50 | Exceptional 10.3% |
| Salvadorans | 99.6 /100 | #51 | Exceptional 10.4% |
| Immigrants | Saudi Arabia | 99.6 /100 | #52 | Exceptional 10.4% |
| Immigrants | Uzbekistan | 99.6 /100 | #53 | Exceptional 10.4% |
| Peruvians | 99.6 /100 | #54 | Exceptional 10.4% |
| Immigrants | Eritrea | 99.6 /100 | #55 | Exceptional 10.4% |
| Tongans | 99.6 /100 | #56 | Exceptional 10.4% |
| Immigrants | South America | 99.6 /100 | #57 | Exceptional 10.4% |
| Immigrants | Japan | 99.5 /100 | #58 | Exceptional 10.4% |
| Immigrants | Australia | 99.5 /100 | #59 | Exceptional 10.4% |
| Immigrants | Colombia | 99.5 /100 | #60 | Exceptional 10.4% |
| Immigrants | Northern Africa | 99.4 /100 | #61 | Exceptional 10.4% |