Immigrants from Honduras vs Welsh Child Poverty Among Girls Under 16
COMPARE
Immigrants from Honduras
Welsh
Child Poverty Among Girls Under 16
Child Poverty Among Girls Under 16 Comparison
Immigrants from Honduras
Welsh
22.8%
CHILD POVERTY AMONG GIRLS UNDER 16
0.0/ 100
METRIC RATING
326th/ 347
METRIC RANK
15.6%
CHILD POVERTY AMONG GIRLS UNDER 16
85.4/ 100
METRIC RATING
145th/ 347
METRIC RANK
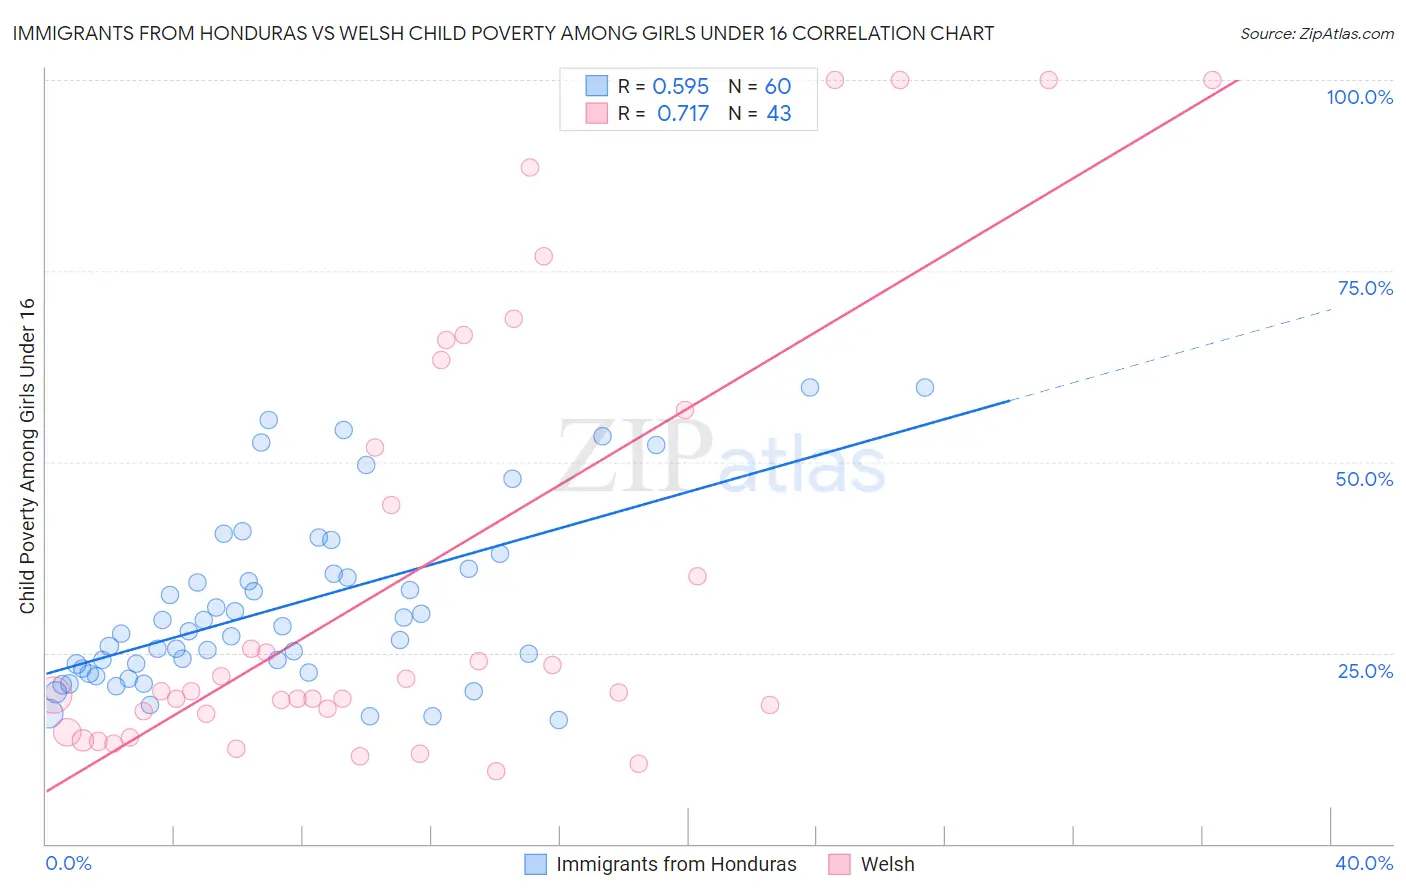
Immigrants from Honduras vs Welsh Child Poverty Among Girls Under 16 Correlation Chart
The statistical analysis conducted on geographies consisting of 320,108,281 people shows a substantial positive correlation between the proportion of Immigrants from Honduras and poverty level among girls under the age of 16 in the United States with a correlation coefficient (R) of 0.595 and weighted average of 22.8%. Similarly, the statistical analysis conducted on geographies consisting of 511,157,850 people shows a strong positive correlation between the proportion of Welsh and poverty level among girls under the age of 16 in the United States with a correlation coefficient (R) of 0.717 and weighted average of 15.6%, a difference of 45.7%.
Child Poverty Among Girls Under 16 Correlation Summary
| Measurement | Immigrants from Honduras | Welsh |
| Minimum | 16.3% | 9.5% |
| Maximum | 59.7% | 100.0% |
| Range | 43.5% | 90.5% |
| Mean | 31.1% | 35.5% |
| Median | 27.7% | 19.9% |
| Interquartile 25% (IQ1) | 22.7% | 17.0% |
| Interquartile 75% (IQ3) | 35.7% | 56.9% |
| Interquartile Range (IQR) | 13.0% | 39.8% |
| Standard Deviation (Sample) | 11.5% | 29.1% |
| Standard Deviation (Population) | 11.4% | 28.8% |
Similar Demographics by Child Poverty Among Girls Under 16
Demographics Similar to Immigrants from Honduras by Child Poverty Among Girls Under 16
In terms of child poverty among girls under 16, the demographic groups most similar to Immigrants from Honduras are Immigrants from Congo (22.7%, a difference of 0.13%), Central American Indian (22.8%, a difference of 0.14%), Paiute (22.6%, a difference of 0.63%), Cajun (22.6%, a difference of 0.92%), and Yakama (22.6%, a difference of 0.93%).
| Demographics | Rating | Rank | Child Poverty Among Girls Under 16 |
| U.S. Virgin Islanders | 0.0 /100 | #319 | Tragic 22.1% |
| Hondurans | 0.0 /100 | #320 | Tragic 22.2% |
| Colville | 0.0 /100 | #321 | Tragic 22.5% |
| Yakama | 0.0 /100 | #322 | Tragic 22.6% |
| Cajuns | 0.0 /100 | #323 | Tragic 22.6% |
| Paiute | 0.0 /100 | #324 | Tragic 22.6% |
| Immigrants | Congo | 0.0 /100 | #325 | Tragic 22.7% |
| Immigrants | Honduras | 0.0 /100 | #326 | Tragic 22.8% |
| Central American Indians | 0.0 /100 | #327 | Tragic 22.8% |
| Dominicans | 0.0 /100 | #328 | Tragic 23.7% |
| Kiowa | 0.0 /100 | #329 | Tragic 23.7% |
| Immigrants | Dominican Republic | 0.0 /100 | #330 | Tragic 23.8% |
| Apache | 0.0 /100 | #331 | Tragic 23.8% |
| Natives/Alaskans | 0.0 /100 | #332 | Tragic 24.0% |
| Blacks/African Americans | 0.0 /100 | #333 | Tragic 24.7% |
Demographics Similar to Welsh by Child Poverty Among Girls Under 16
In terms of child poverty among girls under 16, the demographic groups most similar to Welsh are Israeli (15.6%, a difference of 0.20%), Immigrants from Peru (15.6%, a difference of 0.29%), Samoan (15.7%, a difference of 0.29%), Canadian (15.6%, a difference of 0.44%), and Immigrants from Jordan (15.6%, a difference of 0.46%).
| Demographics | Rating | Rank | Child Poverty Among Girls Under 16 |
| Immigrants | Vietnam | 88.2 /100 | #138 | Excellent 15.5% |
| Armenians | 87.9 /100 | #139 | Excellent 15.5% |
| New Zealanders | 87.2 /100 | #140 | Excellent 15.6% |
| Immigrants | Jordan | 87.2 /100 | #141 | Excellent 15.6% |
| Canadians | 87.1 /100 | #142 | Excellent 15.6% |
| Immigrants | Peru | 86.6 /100 | #143 | Excellent 15.6% |
| Israelis | 86.3 /100 | #144 | Excellent 15.6% |
| Welsh | 85.4 /100 | #145 | Excellent 15.6% |
| Samoans | 84.2 /100 | #146 | Excellent 15.7% |
| Slavs | 83.1 /100 | #147 | Excellent 15.7% |
| Icelanders | 82.4 /100 | #148 | Excellent 15.7% |
| Immigrants | Hungary | 80.9 /100 | #149 | Excellent 15.8% |
| Immigrants | Albania | 80.7 /100 | #150 | Excellent 15.8% |
| Venezuelans | 80.1 /100 | #151 | Excellent 15.8% |
| Immigrants | Kuwait | 79.4 /100 | #152 | Good 15.8% |