Black/African American vs Welsh Self-Care Disability
COMPARE
Black/African American
Welsh
Self-Care Disability
Self-Care Disability Comparison
Blacks/African Americans
Welsh
2.9%
SELF-CARE DISABILITY
0.0/ 100
METRIC RATING
327th/ 347
METRIC RANK
2.5%
SELF-CARE DISABILITY
50.0/ 100
METRIC RATING
174th/ 347
METRIC RANK
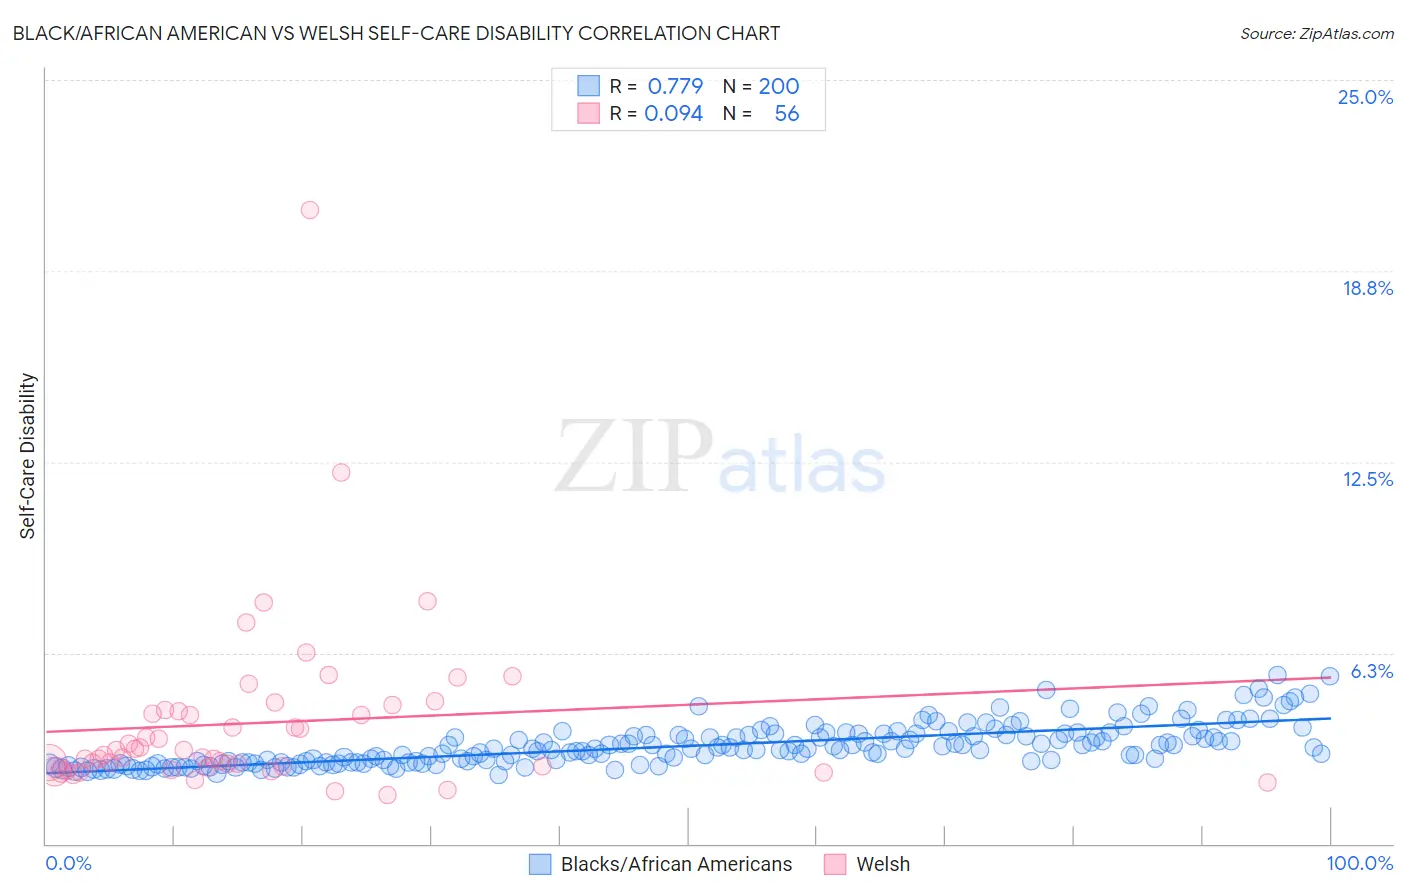
Black/African American vs Welsh Self-Care Disability Correlation Chart
The statistical analysis conducted on geographies consisting of 564,146,018 people shows a strong positive correlation between the proportion of Blacks/African Americans and percentage of population with self-care disability in the United States with a correlation coefficient (R) of 0.779 and weighted average of 2.9%. Similarly, the statistical analysis conducted on geographies consisting of 527,151,887 people shows a slight positive correlation between the proportion of Welsh and percentage of population with self-care disability in the United States with a correlation coefficient (R) of 0.094 and weighted average of 2.5%, a difference of 18.5%.
Self-Care Disability Correlation Summary
| Measurement | Black/African American | Welsh |
| Minimum | 2.3% | 1.6% |
| Maximum | 5.5% | 20.7% |
| Range | 3.2% | 19.1% |
| Mean | 3.2% | 4.0% |
| Median | 3.1% | 3.0% |
| Interquartile 25% (IQ1) | 2.7% | 2.5% |
| Interquartile 75% (IQ3) | 3.6% | 4.4% |
| Interquartile Range (IQR) | 0.89% | 1.8% |
| Standard Deviation (Sample) | 0.67% | 2.9% |
| Standard Deviation (Population) | 0.67% | 2.9% |
Similar Demographics by Self-Care Disability
Demographics Similar to Blacks/African Americans by Self-Care Disability
In terms of self-care disability, the demographic groups most similar to Blacks/African Americans are Paiute (2.9%, a difference of 0.070%), Hopi (2.9%, a difference of 0.39%), Cajun (2.9%, a difference of 0.60%), Immigrants from Uzbekistan (2.9%, a difference of 1.0%), and Nepalese (3.0%, a difference of 1.3%).
| Demographics | Rating | Rank | Self-Care Disability |
| Chickasaw | 0.0 /100 | #320 | Tragic 2.9% |
| Navajo | 0.0 /100 | #321 | Tragic 2.9% |
| Comanche | 0.0 /100 | #322 | Tragic 2.9% |
| Seminole | 0.0 /100 | #323 | Tragic 2.9% |
| Cherokee | 0.0 /100 | #324 | Tragic 2.9% |
| Immigrants | Uzbekistan | 0.0 /100 | #325 | Tragic 2.9% |
| Paiute | 0.0 /100 | #326 | Tragic 2.9% |
| Blacks/African Americans | 0.0 /100 | #327 | Tragic 2.9% |
| Hopi | 0.0 /100 | #328 | Tragic 2.9% |
| Cajuns | 0.0 /100 | #329 | Tragic 2.9% |
| Nepalese | 0.0 /100 | #330 | Tragic 3.0% |
| Lumbee | 0.0 /100 | #331 | Tragic 3.0% |
| Kiowa | 0.0 /100 | #332 | Tragic 3.0% |
| Dutch West Indians | 0.0 /100 | #333 | Tragic 3.0% |
| Houma | 0.0 /100 | #334 | Tragic 3.0% |
Demographics Similar to Welsh by Self-Care Disability
In terms of self-care disability, the demographic groups most similar to Welsh are Immigrants from Bosnia and Herzegovina (2.5%, a difference of 0.020%), Immigrants from Afghanistan (2.5%, a difference of 0.11%), Immigrants from Burma/Myanmar (2.5%, a difference of 0.13%), Immigrants from Kazakhstan (2.5%, a difference of 0.16%), and Pennsylvania German (2.5%, a difference of 0.17%).
| Demographics | Rating | Rank | Self-Care Disability |
| Immigrants | Greece | 57.3 /100 | #167 | Average 2.5% |
| Ute | 57.1 /100 | #168 | Average 2.5% |
| Immigrants | Somalia | 55.9 /100 | #169 | Average 2.5% |
| Scottish | 54.3 /100 | #170 | Average 2.5% |
| Pennsylvania Germans | 53.5 /100 | #171 | Average 2.5% |
| Czechoslovakians | 53.5 /100 | #172 | Average 2.5% |
| Immigrants | Burma/Myanmar | 52.8 /100 | #173 | Average 2.5% |
| Welsh | 50.0 /100 | #174 | Average 2.5% |
| Immigrants | Bosnia and Herzegovina | 49.6 /100 | #175 | Average 2.5% |
| Immigrants | Afghanistan | 47.6 /100 | #176 | Average 2.5% |
| Immigrants | Kazakhstan | 46.7 /100 | #177 | Average 2.5% |
| English | 46.2 /100 | #178 | Average 2.5% |
| Hungarians | 45.5 /100 | #179 | Average 2.5% |
| Indonesians | 41.2 /100 | #180 | Average 2.5% |
| Ghanaians | 40.4 /100 | #181 | Average 2.5% |