Immigrants from England vs Immigrants from Ghana Disability Age 5 to 17
COMPARE
Immigrants from England
Immigrants from Ghana
Disability Age 5 to 17
Disability Age 5 to 17 Comparison
Immigrants from England
Immigrants from Ghana
5.6%
DISABILITY AGE 5 TO 17
36.4/ 100
METRIC RATING
181st/ 347
METRIC RANK
5.9%
DISABILITY AGE 5 TO 17
1.7/ 100
METRIC RATING
249th/ 347
METRIC RANK
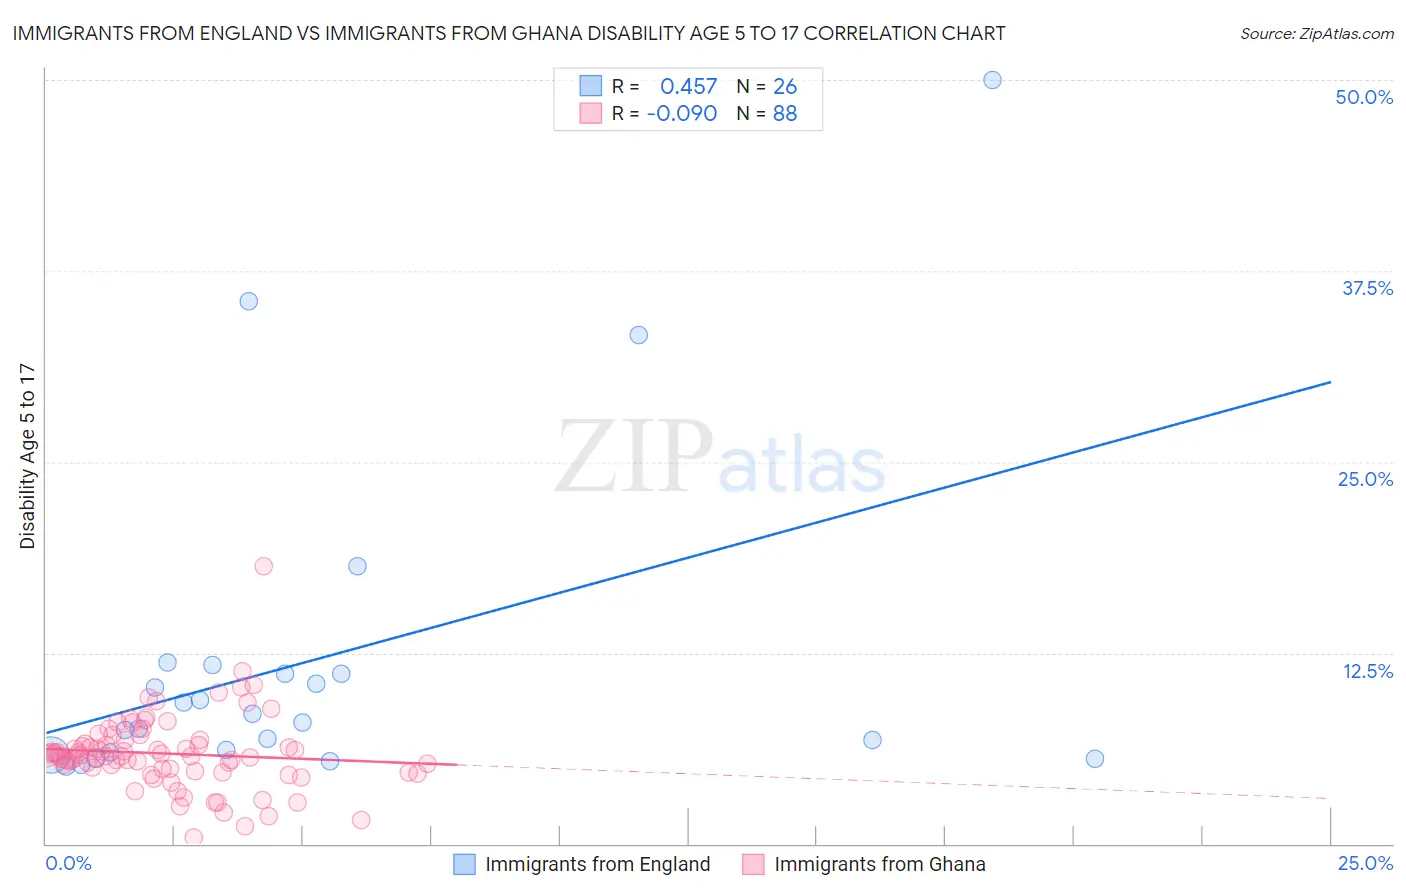
Immigrants from England vs Immigrants from Ghana Disability Age 5 to 17 Correlation Chart
The statistical analysis conducted on geographies consisting of 388,045,043 people shows a moderate positive correlation between the proportion of Immigrants from England and percentage of population with a disability between the ages 5 and 17 in the United States with a correlation coefficient (R) of 0.457 and weighted average of 5.6%. Similarly, the statistical analysis conducted on geographies consisting of 199,220,880 people shows a slight negative correlation between the proportion of Immigrants from Ghana and percentage of population with a disability between the ages 5 and 17 in the United States with a correlation coefficient (R) of -0.090 and weighted average of 5.9%, a difference of 4.3%.
Disability Age 5 to 17 Correlation Summary
| Measurement | Immigrants from England | Immigrants from Ghana |
| Minimum | 5.1% | 0.40% |
| Maximum | 50.0% | 18.2% |
| Range | 44.9% | 17.8% |
| Mean | 12.0% | 5.9% |
| Median | 8.2% | 5.8% |
| Interquartile 25% (IQ1) | 6.0% | 4.8% |
| Interquartile 75% (IQ3) | 11.1% | 6.7% |
| Interquartile Range (IQR) | 5.2% | 1.9% |
| Standard Deviation (Sample) | 10.9% | 2.5% |
| Standard Deviation (Population) | 10.7% | 2.4% |
Similar Demographics by Disability Age 5 to 17
Demographics Similar to Immigrants from England by Disability Age 5 to 17
In terms of disability age 5 to 17, the demographic groups most similar to Immigrants from England are Mexican American Indian (5.6%, a difference of 0.060%), Immigrants from Uruguay (5.6%, a difference of 0.070%), Immigrants from Latin America (5.6%, a difference of 0.11%), Syrian (5.6%, a difference of 0.14%), and Immigrants from Mexico (5.6%, a difference of 0.14%).
| Demographics | Rating | Rank | Disability Age 5 to 17 |
| Costa Ricans | 50.0 /100 | #174 | Average 5.6% |
| Shoshone | 49.4 /100 | #175 | Average 5.6% |
| Immigrants | Central America | 49.4 /100 | #176 | Average 5.6% |
| Immigrants | Western Europe | 47.8 /100 | #177 | Average 5.6% |
| Immigrants | Trinidad and Tobago | 47.6 /100 | #178 | Average 5.6% |
| Immigrants | Barbados | 40.5 /100 | #179 | Average 5.6% |
| Immigrants | Uruguay | 37.7 /100 | #180 | Fair 5.6% |
| Immigrants | England | 36.4 /100 | #181 | Fair 5.6% |
| Mexican American Indians | 35.2 /100 | #182 | Fair 5.6% |
| Immigrants | Latin America | 34.3 /100 | #183 | Fair 5.6% |
| Syrians | 33.8 /100 | #184 | Fair 5.6% |
| Immigrants | Mexico | 33.7 /100 | #185 | Fair 5.6% |
| Fijians | 31.7 /100 | #186 | Fair 5.7% |
| Immigrants | Thailand | 30.2 /100 | #187 | Fair 5.7% |
| Marshallese | 28.1 /100 | #188 | Fair 5.7% |
Demographics Similar to Immigrants from Ghana by Disability Age 5 to 17
In terms of disability age 5 to 17, the demographic groups most similar to Immigrants from Ghana are British (5.9%, a difference of 0.010%), Immigrants from Honduras (5.9%, a difference of 0.090%), Immigrants from Germany (5.9%, a difference of 0.12%), Immigrants from Micronesia (5.9%, a difference of 0.12%), and Tlingit-Haida (5.9%, a difference of 0.12%).
| Demographics | Rating | Rank | Disability Age 5 to 17 |
| Spaniards | 2.0 /100 | #242 | Tragic 5.9% |
| Indonesians | 2.0 /100 | #243 | Tragic 5.9% |
| Immigrants | Germany | 1.9 /100 | #244 | Tragic 5.9% |
| Immigrants | Micronesia | 1.9 /100 | #245 | Tragic 5.9% |
| Tlingit-Haida | 1.9 /100 | #246 | Tragic 5.9% |
| Immigrants | Honduras | 1.8 /100 | #247 | Tragic 5.9% |
| British | 1.7 /100 | #248 | Tragic 5.9% |
| Immigrants | Ghana | 1.7 /100 | #249 | Tragic 5.9% |
| Poles | 1.5 /100 | #250 | Tragic 5.9% |
| Immigrants | Cambodia | 1.5 /100 | #251 | Tragic 5.9% |
| Hondurans | 1.5 /100 | #252 | Tragic 5.9% |
| Scandinavians | 1.4 /100 | #253 | Tragic 5.9% |
| Barbadians | 1.3 /100 | #254 | Tragic 5.9% |
| Italians | 1.2 /100 | #255 | Tragic 5.9% |
| Hopi | 1.0 /100 | #256 | Tragic 5.9% |