Immigrants from England vs Immigrants from Sweden 9th Grade
COMPARE
Immigrants from England
Immigrants from Sweden
9th Grade
9th Grade Comparison
Immigrants from England
Immigrants from Sweden
95.9%
9TH GRADE
99.6/ 100
METRIC RATING
65th/ 347
METRIC RANK
95.8%
9TH GRADE
99.5/ 100
METRIC RATING
76th/ 347
METRIC RANK
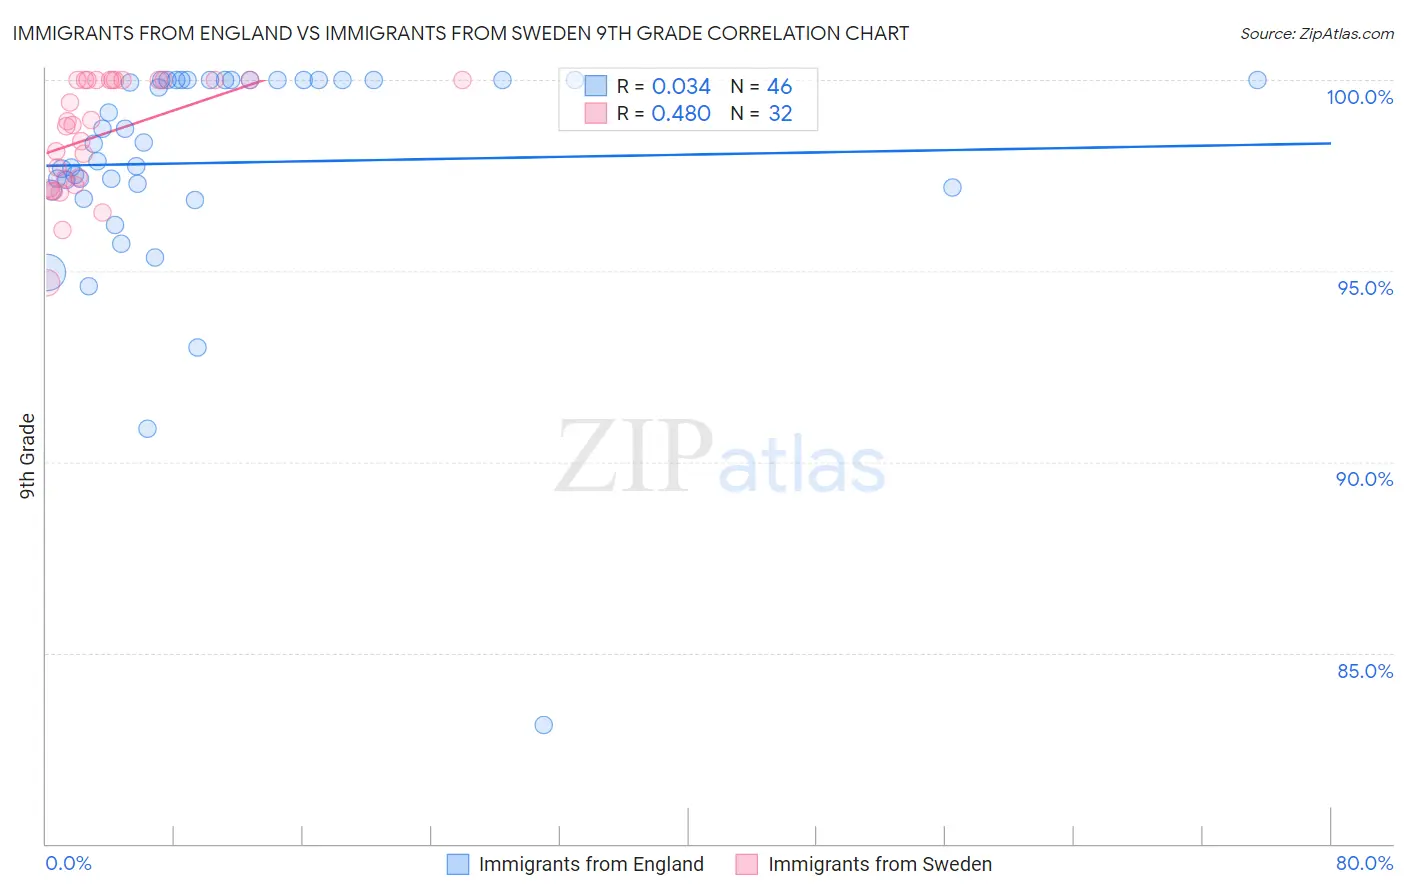
Immigrants from England vs Immigrants from Sweden 9th Grade Correlation Chart
The statistical analysis conducted on geographies consisting of 391,897,462 people shows no correlation between the proportion of Immigrants from England and percentage of population with at least 9th grade education in the United States with a correlation coefficient (R) of 0.034 and weighted average of 95.9%. Similarly, the statistical analysis conducted on geographies consisting of 164,736,894 people shows a moderate positive correlation between the proportion of Immigrants from Sweden and percentage of population with at least 9th grade education in the United States with a correlation coefficient (R) of 0.480 and weighted average of 95.8%, a difference of 0.080%.
9th Grade Correlation Summary
| Measurement | Immigrants from England | Immigrants from Sweden |
| Minimum | 83.1% | 94.7% |
| Maximum | 100.0% | 100.0% |
| Range | 16.9% | 5.3% |
| Mean | 97.8% | 98.6% |
| Median | 98.3% | 98.9% |
| Interquartile 25% (IQ1) | 97.2% | 97.3% |
| Interquartile 75% (IQ3) | 100.0% | 100.0% |
| Interquartile Range (IQR) | 2.8% | 2.7% |
| Standard Deviation (Sample) | 3.0% | 1.5% |
| Standard Deviation (Population) | 3.0% | 1.5% |
Demographics Similar to Immigrants from England and Immigrants from Sweden by 9th Grade
In terms of 9th grade, the demographic groups most similar to Immigrants from England are Zimbabwean (95.9%, a difference of 0.010%), Canadian (95.9%, a difference of 0.020%), Immigrants from Netherlands (95.8%, a difference of 0.020%), Cypriot (95.8%, a difference of 0.020%), and Immigrants from Ireland (95.8%, a difference of 0.030%). Similarly, the demographic groups most similar to Immigrants from Sweden are Inupiat (95.8%, a difference of 0.010%), White/Caucasian (95.8%, a difference of 0.010%), Immigrants from South Africa (95.8%, a difference of 0.010%), Immigrants from Singapore (95.8%, a difference of 0.020%), and Thai (95.8%, a difference of 0.020%).
| Demographics | Rating | Rank | 9th Grade |
| Native Hawaiians | 99.8 /100 | #60 | Exceptional 95.9% |
| Sioux | 99.8 /100 | #61 | Exceptional 95.9% |
| Ukrainians | 99.7 /100 | #62 | Exceptional 95.9% |
| Canadians | 99.7 /100 | #63 | Exceptional 95.9% |
| Zimbabweans | 99.7 /100 | #64 | Exceptional 95.9% |
| Immigrants | England | 99.6 /100 | #65 | Exceptional 95.9% |
| Immigrants | Netherlands | 99.6 /100 | #66 | Exceptional 95.8% |
| Cypriots | 99.6 /100 | #67 | Exceptional 95.8% |
| Immigrants | Ireland | 99.6 /100 | #68 | Exceptional 95.8% |
| Immigrants | Lithuania | 99.6 /100 | #69 | Exceptional 95.8% |
| Immigrants | Australia | 99.5 /100 | #70 | Exceptional 95.8% |
| Immigrants | Belgium | 99.5 /100 | #71 | Exceptional 95.8% |
| Turks | 99.5 /100 | #72 | Exceptional 95.8% |
| Immigrants | Singapore | 99.5 /100 | #73 | Exceptional 95.8% |
| Thais | 99.5 /100 | #74 | Exceptional 95.8% |
| Inupiat | 99.5 /100 | #75 | Exceptional 95.8% |
| Immigrants | Sweden | 99.5 /100 | #76 | Exceptional 95.8% |
| Whites/Caucasians | 99.4 /100 | #77 | Exceptional 95.8% |
| Immigrants | South Africa | 99.4 /100 | #78 | Exceptional 95.8% |
| Romanians | 99.3 /100 | #79 | Exceptional 95.7% |
| Bhutanese | 99.3 /100 | #80 | Exceptional 95.7% |