Immigrants from England vs British West Indian Disability Age 5 to 17
COMPARE
Immigrants from England
British West Indian
Disability Age 5 to 17
Disability Age 5 to 17 Comparison
Immigrants from England
British West Indians
5.6%
DISABILITY AGE 5 TO 17
36.4/ 100
METRIC RATING
181st/ 347
METRIC RANK
5.8%
DISABILITY AGE 5 TO 17
5.4/ 100
METRIC RATING
226th/ 347
METRIC RANK
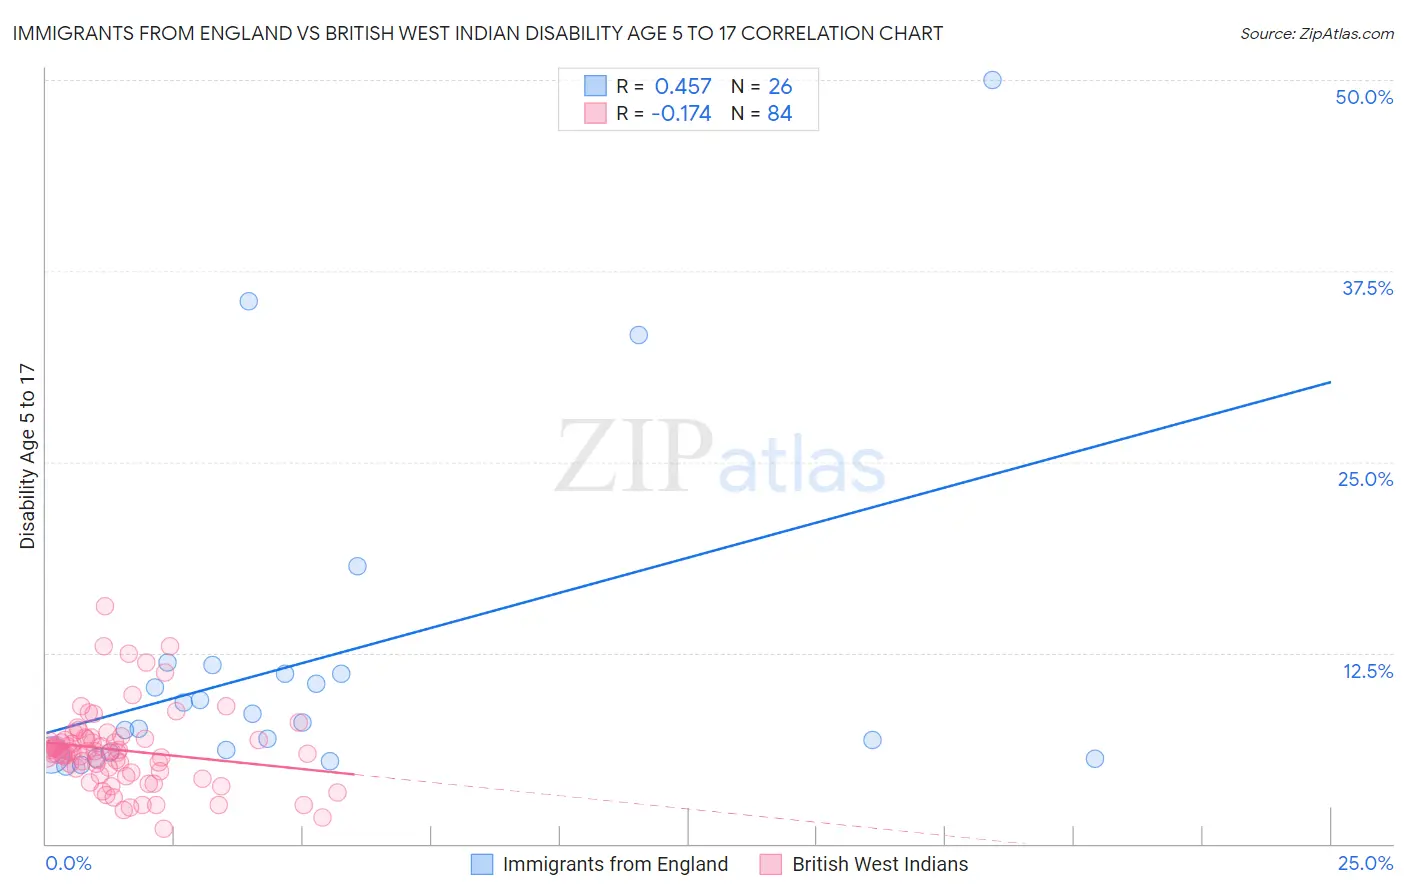
Immigrants from England vs British West Indian Disability Age 5 to 17 Correlation Chart
The statistical analysis conducted on geographies consisting of 388,045,043 people shows a moderate positive correlation between the proportion of Immigrants from England and percentage of population with a disability between the ages 5 and 17 in the United States with a correlation coefficient (R) of 0.457 and weighted average of 5.6%. Similarly, the statistical analysis conducted on geographies consisting of 152,257,483 people shows a poor negative correlation between the proportion of British West Indians and percentage of population with a disability between the ages 5 and 17 in the United States with a correlation coefficient (R) of -0.174 and weighted average of 5.8%, a difference of 2.8%.
Disability Age 5 to 17 Correlation Summary
| Measurement | Immigrants from England | British West Indian |
| Minimum | 5.1% | 1.0% |
| Maximum | 50.0% | 15.5% |
| Range | 44.9% | 14.5% |
| Mean | 12.0% | 6.1% |
| Median | 8.2% | 6.0% |
| Interquartile 25% (IQ1) | 6.0% | 4.7% |
| Interquartile 75% (IQ3) | 11.1% | 6.9% |
| Interquartile Range (IQR) | 5.2% | 2.2% |
| Standard Deviation (Sample) | 10.9% | 2.6% |
| Standard Deviation (Population) | 10.7% | 2.6% |
Similar Demographics by Disability Age 5 to 17
Demographics Similar to Immigrants from England by Disability Age 5 to 17
In terms of disability age 5 to 17, the demographic groups most similar to Immigrants from England are Mexican American Indian (5.6%, a difference of 0.060%), Immigrants from Uruguay (5.6%, a difference of 0.070%), Immigrants from Latin America (5.6%, a difference of 0.11%), Syrian (5.6%, a difference of 0.14%), and Immigrants from Mexico (5.6%, a difference of 0.14%).
| Demographics | Rating | Rank | Disability Age 5 to 17 |
| Costa Ricans | 50.0 /100 | #174 | Average 5.6% |
| Shoshone | 49.4 /100 | #175 | Average 5.6% |
| Immigrants | Central America | 49.4 /100 | #176 | Average 5.6% |
| Immigrants | Western Europe | 47.8 /100 | #177 | Average 5.6% |
| Immigrants | Trinidad and Tobago | 47.6 /100 | #178 | Average 5.6% |
| Immigrants | Barbados | 40.5 /100 | #179 | Average 5.6% |
| Immigrants | Uruguay | 37.7 /100 | #180 | Fair 5.6% |
| Immigrants | England | 36.4 /100 | #181 | Fair 5.6% |
| Mexican American Indians | 35.2 /100 | #182 | Fair 5.6% |
| Immigrants | Latin America | 34.3 /100 | #183 | Fair 5.6% |
| Syrians | 33.8 /100 | #184 | Fair 5.6% |
| Immigrants | Mexico | 33.7 /100 | #185 | Fair 5.6% |
| Fijians | 31.7 /100 | #186 | Fair 5.7% |
| Immigrants | Thailand | 30.2 /100 | #187 | Fair 5.7% |
| Marshallese | 28.1 /100 | #188 | Fair 5.7% |
Demographics Similar to British West Indians by Disability Age 5 to 17
In terms of disability age 5 to 17, the demographic groups most similar to British West Indians are Guamanian/Chamorro (5.8%, a difference of 0.040%), Mexican (5.8%, a difference of 0.060%), Swiss (5.8%, a difference of 0.080%), Alsatian (5.8%, a difference of 0.12%), and Haitian (5.8%, a difference of 0.16%).
| Demographics | Rating | Rank | Disability Age 5 to 17 |
| Sierra Leoneans | 7.0 /100 | #219 | Tragic 5.8% |
| Belgians | 6.9 /100 | #220 | Tragic 5.8% |
| Lithuanians | 6.7 /100 | #221 | Tragic 5.8% |
| Immigrants | Sudan | 6.7 /100 | #222 | Tragic 5.8% |
| Alsatians | 6.0 /100 | #223 | Tragic 5.8% |
| Mexicans | 5.7 /100 | #224 | Tragic 5.8% |
| Guamanians/Chamorros | 5.6 /100 | #225 | Tragic 5.8% |
| British West Indians | 5.4 /100 | #226 | Tragic 5.8% |
| Swiss | 5.1 /100 | #227 | Tragic 5.8% |
| Haitians | 4.8 /100 | #228 | Tragic 5.8% |
| Bangladeshis | 4.8 /100 | #229 | Tragic 5.8% |
| Ghanaians | 4.7 /100 | #230 | Tragic 5.8% |
| Europeans | 4.5 /100 | #231 | Tragic 5.8% |
| Immigrants | Laos | 3.8 /100 | #232 | Tragic 5.8% |
| Immigrants | West Indies | 3.5 /100 | #233 | Tragic 5.8% |