Immigrants from Cuba vs Immigrants from Japan Disability Age 5 to 17
COMPARE
Immigrants from Cuba
Immigrants from Japan
Disability Age 5 to 17
Disability Age 5 to 17 Comparison
Immigrants from Cuba
Immigrants from Japan
5.2%
DISABILITY AGE 5 TO 17
99.6/ 100
METRIC RATING
78th/ 347
METRIC RANK
4.9%
DISABILITY AGE 5 TO 17
100.0/ 100
METRIC RATING
28th/ 347
METRIC RANK
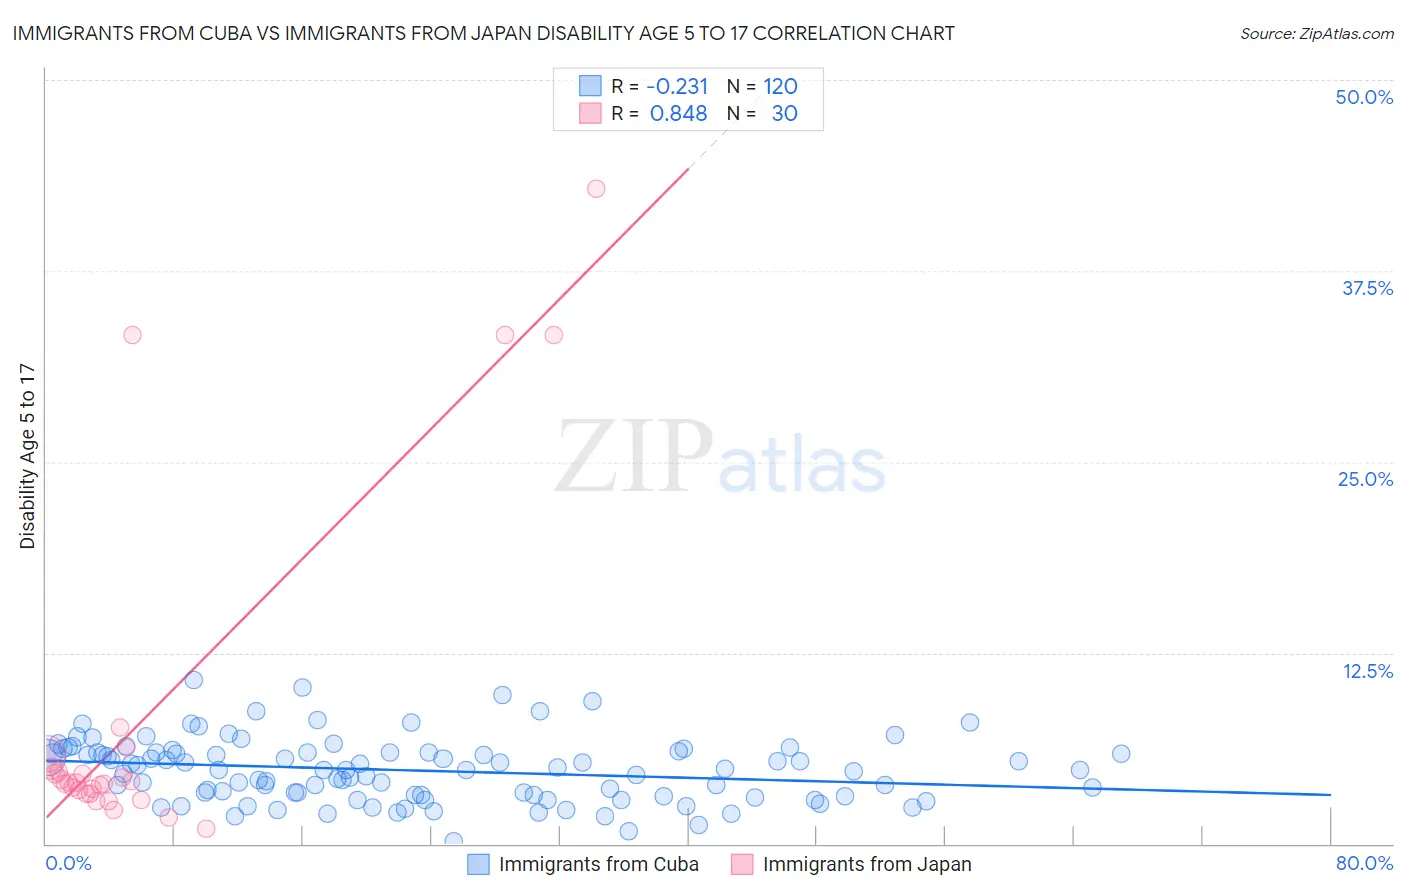
Immigrants from Cuba vs Immigrants from Japan Disability Age 5 to 17 Correlation Chart
The statistical analysis conducted on geographies consisting of 323,753,754 people shows a weak negative correlation between the proportion of Immigrants from Cuba and percentage of population with a disability between the ages 5 and 17 in the United States with a correlation coefficient (R) of -0.231 and weighted average of 5.2%. Similarly, the statistical analysis conducted on geographies consisting of 337,854,464 people shows a very strong positive correlation between the proportion of Immigrants from Japan and percentage of population with a disability between the ages 5 and 17 in the United States with a correlation coefficient (R) of 0.848 and weighted average of 4.9%, a difference of 6.0%.
Disability Age 5 to 17 Correlation Summary
| Measurement | Immigrants from Cuba | Immigrants from Japan |
| Minimum | 0.17% | 0.95% |
| Maximum | 10.7% | 42.9% |
| Range | 10.6% | 41.9% |
| Mean | 4.8% | 8.2% |
| Median | 4.8% | 4.0% |
| Interquartile 25% (IQ1) | 3.2% | 3.3% |
| Interquartile 75% (IQ3) | 6.0% | 4.9% |
| Interquartile Range (IQR) | 2.8% | 1.7% |
| Standard Deviation (Sample) | 2.0% | 11.2% |
| Standard Deviation (Population) | 2.0% | 11.0% |
Similar Demographics by Disability Age 5 to 17
Demographics Similar to Immigrants from Cuba by Disability Age 5 to 17
In terms of disability age 5 to 17, the demographic groups most similar to Immigrants from Cuba are Immigrants from Kazakhstan (5.2%, a difference of 0.010%), Immigrants from Guyana (5.2%, a difference of 0.040%), Afghan (5.2%, a difference of 0.040%), Sri Lankan (5.2%, a difference of 0.060%), and Immigrants from Moldova (5.2%, a difference of 0.070%).
| Demographics | Rating | Rank | Disability Age 5 to 17 |
| Jordanians | 99.7 /100 | #71 | Exceptional 5.2% |
| Immigrants | Vietnam | 99.7 /100 | #72 | Exceptional 5.2% |
| Immigrants | Czechoslovakia | 99.7 /100 | #73 | Exceptional 5.2% |
| Immigrants | Romania | 99.7 /100 | #74 | Exceptional 5.2% |
| Immigrants | Moldova | 99.6 /100 | #75 | Exceptional 5.2% |
| Immigrants | Guyana | 99.6 /100 | #76 | Exceptional 5.2% |
| Immigrants | Kazakhstan | 99.6 /100 | #77 | Exceptional 5.2% |
| Immigrants | Cuba | 99.6 /100 | #78 | Exceptional 5.2% |
| Afghans | 99.6 /100 | #79 | Exceptional 5.2% |
| Sri Lankans | 99.6 /100 | #80 | Exceptional 5.2% |
| Native Hawaiians | 99.6 /100 | #81 | Exceptional 5.2% |
| Immigrants | Sweden | 99.5 /100 | #82 | Exceptional 5.2% |
| Immigrants | France | 99.5 /100 | #83 | Exceptional 5.2% |
| Immigrants | Nicaragua | 99.5 /100 | #84 | Exceptional 5.2% |
| Bulgarians | 99.4 /100 | #85 | Exceptional 5.2% |
Demographics Similar to Immigrants from Japan by Disability Age 5 to 17
In terms of disability age 5 to 17, the demographic groups most similar to Immigrants from Japan are Taiwanese (4.9%, a difference of 0.080%), Immigrants from Serbia (4.9%, a difference of 0.48%), Bhutanese (4.9%, a difference of 0.64%), Immigrants from Malaysia (5.0%, a difference of 0.70%), and Immigrants from Pakistan (5.0%, a difference of 0.95%).
| Demographics | Rating | Rank | Disability Age 5 to 17 |
| Yup'ik | 100.0 /100 | #21 | Exceptional 4.8% |
| Asians | 100.0 /100 | #22 | Exceptional 4.8% |
| Immigrants | Bolivia | 100.0 /100 | #23 | Exceptional 4.8% |
| Immigrants | Lebanon | 100.0 /100 | #24 | Exceptional 4.8% |
| Immigrants | Asia | 100.0 /100 | #25 | Exceptional 4.8% |
| Bhutanese | 100.0 /100 | #26 | Exceptional 4.9% |
| Taiwanese | 100.0 /100 | #27 | Exceptional 4.9% |
| Immigrants | Japan | 100.0 /100 | #28 | Exceptional 4.9% |
| Immigrants | Serbia | 100.0 /100 | #29 | Exceptional 4.9% |
| Immigrants | Malaysia | 100.0 /100 | #30 | Exceptional 5.0% |
| Immigrants | Pakistan | 100.0 /100 | #31 | Exceptional 5.0% |
| Soviet Union | 100.0 /100 | #32 | Exceptional 5.0% |
| Immigrants | Indonesia | 100.0 /100 | #33 | Exceptional 5.0% |
| Israelis | 100.0 /100 | #34 | Exceptional 5.0% |
| Bolivians | 100.0 /100 | #35 | Exceptional 5.0% |