Immigrants from Cuba vs Canadian Disability Age 5 to 17
COMPARE
Immigrants from Cuba
Canadian
Disability Age 5 to 17
Disability Age 5 to 17 Comparison
Immigrants from Cuba
Canadians
5.2%
DISABILITY AGE 5 TO 17
99.6/ 100
METRIC RATING
78th/ 347
METRIC RANK
6.0%
DISABILITY AGE 5 TO 17
0.6/ 100
METRIC RATING
264th/ 347
METRIC RANK
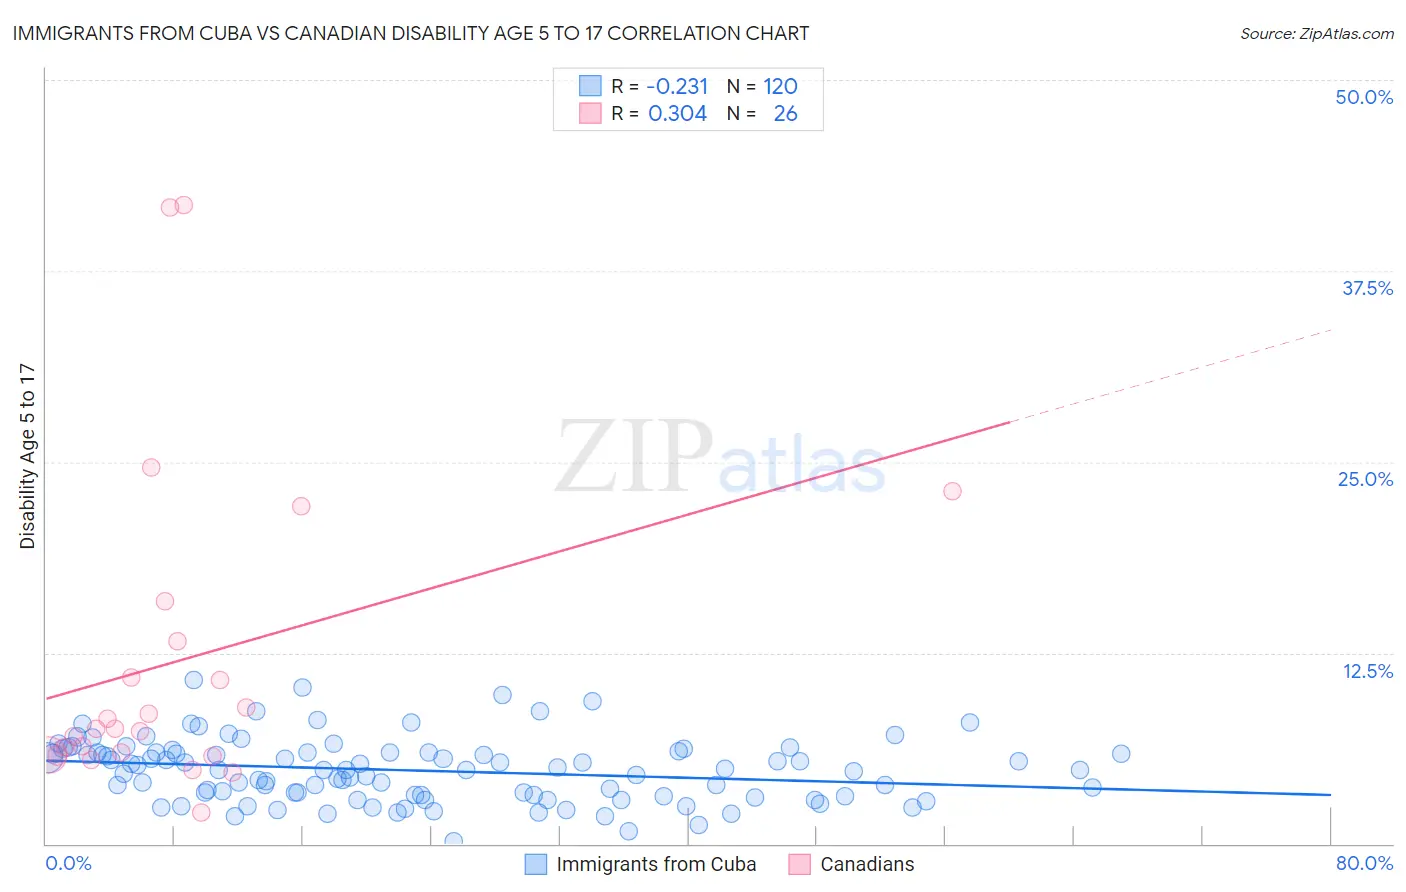
Immigrants from Cuba vs Canadian Disability Age 5 to 17 Correlation Chart
The statistical analysis conducted on geographies consisting of 323,753,754 people shows a weak negative correlation between the proportion of Immigrants from Cuba and percentage of population with a disability between the ages 5 and 17 in the United States with a correlation coefficient (R) of -0.231 and weighted average of 5.2%. Similarly, the statistical analysis conducted on geographies consisting of 432,656,335 people shows a mild positive correlation between the proportion of Canadians and percentage of population with a disability between the ages 5 and 17 in the United States with a correlation coefficient (R) of 0.304 and weighted average of 6.0%, a difference of 14.0%.
Disability Age 5 to 17 Correlation Summary
| Measurement | Immigrants from Cuba | Canadian |
| Minimum | 0.17% | 2.1% |
| Maximum | 10.7% | 41.8% |
| Range | 10.6% | 39.7% |
| Mean | 4.8% | 12.0% |
| Median | 4.8% | 7.5% |
| Interquartile 25% (IQ1) | 3.2% | 5.8% |
| Interquartile 75% (IQ3) | 6.0% | 13.2% |
| Interquartile Range (IQR) | 2.8% | 7.4% |
| Standard Deviation (Sample) | 2.0% | 10.5% |
| Standard Deviation (Population) | 2.0% | 10.3% |
Similar Demographics by Disability Age 5 to 17
Demographics Similar to Immigrants from Cuba by Disability Age 5 to 17
In terms of disability age 5 to 17, the demographic groups most similar to Immigrants from Cuba are Immigrants from Kazakhstan (5.2%, a difference of 0.010%), Immigrants from Guyana (5.2%, a difference of 0.040%), Afghan (5.2%, a difference of 0.040%), Sri Lankan (5.2%, a difference of 0.060%), and Immigrants from Moldova (5.2%, a difference of 0.070%).
| Demographics | Rating | Rank | Disability Age 5 to 17 |
| Jordanians | 99.7 /100 | #71 | Exceptional 5.2% |
| Immigrants | Vietnam | 99.7 /100 | #72 | Exceptional 5.2% |
| Immigrants | Czechoslovakia | 99.7 /100 | #73 | Exceptional 5.2% |
| Immigrants | Romania | 99.7 /100 | #74 | Exceptional 5.2% |
| Immigrants | Moldova | 99.6 /100 | #75 | Exceptional 5.2% |
| Immigrants | Guyana | 99.6 /100 | #76 | Exceptional 5.2% |
| Immigrants | Kazakhstan | 99.6 /100 | #77 | Exceptional 5.2% |
| Immigrants | Cuba | 99.6 /100 | #78 | Exceptional 5.2% |
| Afghans | 99.6 /100 | #79 | Exceptional 5.2% |
| Sri Lankans | 99.6 /100 | #80 | Exceptional 5.2% |
| Native Hawaiians | 99.6 /100 | #81 | Exceptional 5.2% |
| Immigrants | Sweden | 99.5 /100 | #82 | Exceptional 5.2% |
| Immigrants | France | 99.5 /100 | #83 | Exceptional 5.2% |
| Immigrants | Nicaragua | 99.5 /100 | #84 | Exceptional 5.2% |
| Bulgarians | 99.4 /100 | #85 | Exceptional 5.2% |
Demographics Similar to Canadians by Disability Age 5 to 17
In terms of disability age 5 to 17, the demographic groups most similar to Canadians are Panamanian (6.0%, a difference of 0.070%), Slovene (6.0%, a difference of 0.10%), Czechoslovakian (5.9%, a difference of 0.12%), Immigrants from Western Africa (5.9%, a difference of 0.20%), and Spanish (6.0%, a difference of 0.21%).
| Demographics | Rating | Rank | Disability Age 5 to 17 |
| Hispanics or Latinos | 1.0 /100 | #257 | Tragic 5.9% |
| Brazilians | 0.9 /100 | #258 | Tragic 5.9% |
| Slavs | 0.9 /100 | #259 | Tragic 5.9% |
| Somalis | 0.8 /100 | #260 | Tragic 5.9% |
| Immigrants | Middle Africa | 0.7 /100 | #261 | Tragic 5.9% |
| Immigrants | Western Africa | 0.7 /100 | #262 | Tragic 5.9% |
| Czechoslovakians | 0.7 /100 | #263 | Tragic 5.9% |
| Canadians | 0.6 /100 | #264 | Tragic 6.0% |
| Panamanians | 0.6 /100 | #265 | Tragic 6.0% |
| Slovenes | 0.6 /100 | #266 | Tragic 6.0% |
| Spanish | 0.5 /100 | #267 | Tragic 6.0% |
| Sioux | 0.4 /100 | #268 | Tragic 6.0% |
| Liberians | 0.4 /100 | #269 | Tragic 6.0% |
| Immigrants | Somalia | 0.4 /100 | #270 | Tragic 6.0% |
| Immigrants | Zaire | 0.2 /100 | #271 | Tragic 6.0% |