Luxembourger vs Immigrants from Japan Disability Age 5 to 17
COMPARE
Luxembourger
Immigrants from Japan
Disability Age 5 to 17
Disability Age 5 to 17 Comparison
Luxembourgers
Immigrants from Japan
5.3%
DISABILITY AGE 5 TO 17
99.2/ 100
METRIC RATING
92nd/ 347
METRIC RANK
4.9%
DISABILITY AGE 5 TO 17
100.0/ 100
METRIC RATING
28th/ 347
METRIC RANK
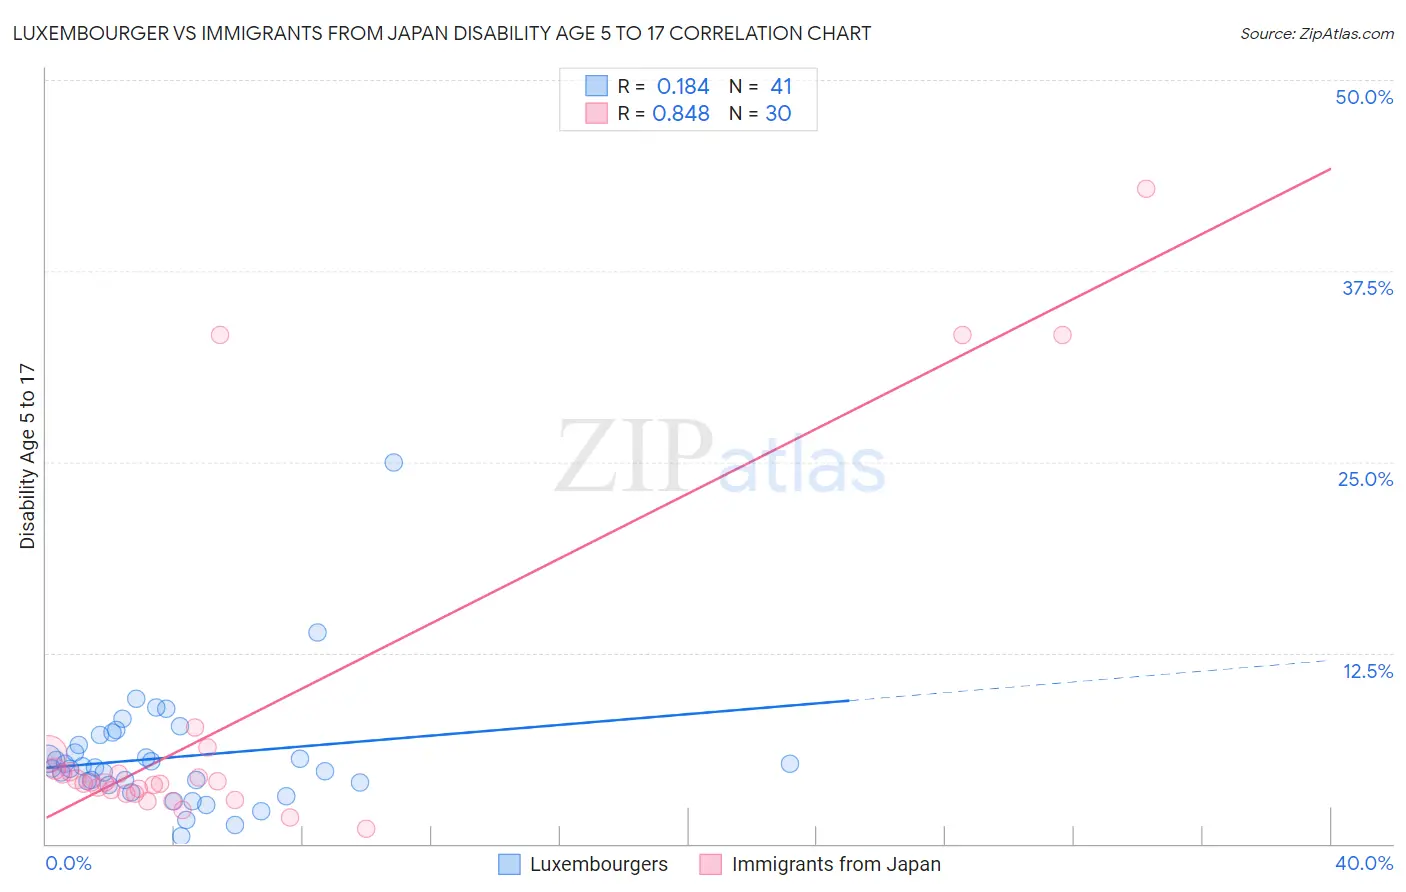
Luxembourger vs Immigrants from Japan Disability Age 5 to 17 Correlation Chart
The statistical analysis conducted on geographies consisting of 143,736,782 people shows a poor positive correlation between the proportion of Luxembourgers and percentage of population with a disability between the ages 5 and 17 in the United States with a correlation coefficient (R) of 0.184 and weighted average of 5.3%. Similarly, the statistical analysis conducted on geographies consisting of 337,854,464 people shows a very strong positive correlation between the proportion of Immigrants from Japan and percentage of population with a disability between the ages 5 and 17 in the United States with a correlation coefficient (R) of 0.848 and weighted average of 4.9%, a difference of 7.0%.
Disability Age 5 to 17 Correlation Summary
| Measurement | Luxembourger | Immigrants from Japan |
| Minimum | 0.53% | 0.95% |
| Maximum | 25.0% | 42.9% |
| Range | 24.5% | 41.9% |
| Mean | 5.7% | 8.2% |
| Median | 5.0% | 4.0% |
| Interquartile 25% (IQ1) | 3.9% | 3.3% |
| Interquartile 75% (IQ3) | 6.8% | 4.9% |
| Interquartile Range (IQR) | 2.8% | 1.7% |
| Standard Deviation (Sample) | 4.0% | 11.2% |
| Standard Deviation (Population) | 3.9% | 11.0% |
Similar Demographics by Disability Age 5 to 17
Demographics Similar to Luxembourgers by Disability Age 5 to 17
In terms of disability age 5 to 17, the demographic groups most similar to Luxembourgers are Mongolian (5.3%, a difference of 0.010%), Immigrants from Peru (5.3%, a difference of 0.080%), Immigrants from Jordan (5.3%, a difference of 0.14%), Immigrants from Grenada (5.3%, a difference of 0.16%), and Immigrants from Kuwait (5.3%, a difference of 0.30%).
| Demographics | Rating | Rank | Disability Age 5 to 17 |
| Bulgarians | 99.4 /100 | #85 | Exceptional 5.2% |
| Immigrants | St. Vincent and the Grenadines | 99.4 /100 | #86 | Exceptional 5.2% |
| Eastern Europeans | 99.4 /100 | #87 | Exceptional 5.2% |
| Immigrants | Croatia | 99.4 /100 | #88 | Exceptional 5.2% |
| Immigrants | Spain | 99.4 /100 | #89 | Exceptional 5.2% |
| Immigrants | Kuwait | 99.4 /100 | #90 | Exceptional 5.3% |
| Mongolians | 99.2 /100 | #91 | Exceptional 5.3% |
| Luxembourgers | 99.2 /100 | #92 | Exceptional 5.3% |
| Immigrants | Peru | 99.1 /100 | #93 | Exceptional 5.3% |
| Immigrants | Jordan | 99.1 /100 | #94 | Exceptional 5.3% |
| Immigrants | Grenada | 99.1 /100 | #95 | Exceptional 5.3% |
| Immigrants | El Salvador | 99.0 /100 | #96 | Exceptional 5.3% |
| Immigrants | Europe | 99.0 /100 | #97 | Exceptional 5.3% |
| Immigrants | Austria | 98.9 /100 | #98 | Exceptional 5.3% |
| Cambodians | 98.8 /100 | #99 | Exceptional 5.3% |
Demographics Similar to Immigrants from Japan by Disability Age 5 to 17
In terms of disability age 5 to 17, the demographic groups most similar to Immigrants from Japan are Taiwanese (4.9%, a difference of 0.080%), Immigrants from Serbia (4.9%, a difference of 0.48%), Bhutanese (4.9%, a difference of 0.64%), Immigrants from Malaysia (5.0%, a difference of 0.70%), and Immigrants from Pakistan (5.0%, a difference of 0.95%).
| Demographics | Rating | Rank | Disability Age 5 to 17 |
| Yup'ik | 100.0 /100 | #21 | Exceptional 4.8% |
| Asians | 100.0 /100 | #22 | Exceptional 4.8% |
| Immigrants | Bolivia | 100.0 /100 | #23 | Exceptional 4.8% |
| Immigrants | Lebanon | 100.0 /100 | #24 | Exceptional 4.8% |
| Immigrants | Asia | 100.0 /100 | #25 | Exceptional 4.8% |
| Bhutanese | 100.0 /100 | #26 | Exceptional 4.9% |
| Taiwanese | 100.0 /100 | #27 | Exceptional 4.9% |
| Immigrants | Japan | 100.0 /100 | #28 | Exceptional 4.9% |
| Immigrants | Serbia | 100.0 /100 | #29 | Exceptional 4.9% |
| Immigrants | Malaysia | 100.0 /100 | #30 | Exceptional 5.0% |
| Immigrants | Pakistan | 100.0 /100 | #31 | Exceptional 5.0% |
| Soviet Union | 100.0 /100 | #32 | Exceptional 5.0% |
| Immigrants | Indonesia | 100.0 /100 | #33 | Exceptional 5.0% |
| Israelis | 100.0 /100 | #34 | Exceptional 5.0% |
| Bolivians | 100.0 /100 | #35 | Exceptional 5.0% |