Immigrants from Cuba vs Choctaw Disability Age 5 to 17
COMPARE
Immigrants from Cuba
Choctaw
Disability Age 5 to 17
Disability Age 5 to 17 Comparison
Immigrants from Cuba
Choctaw
5.2%
DISABILITY AGE 5 TO 17
99.6/ 100
METRIC RATING
78th/ 347
METRIC RANK
6.9%
DISABILITY AGE 5 TO 17
0.0/ 100
METRIC RATING
339th/ 347
METRIC RANK
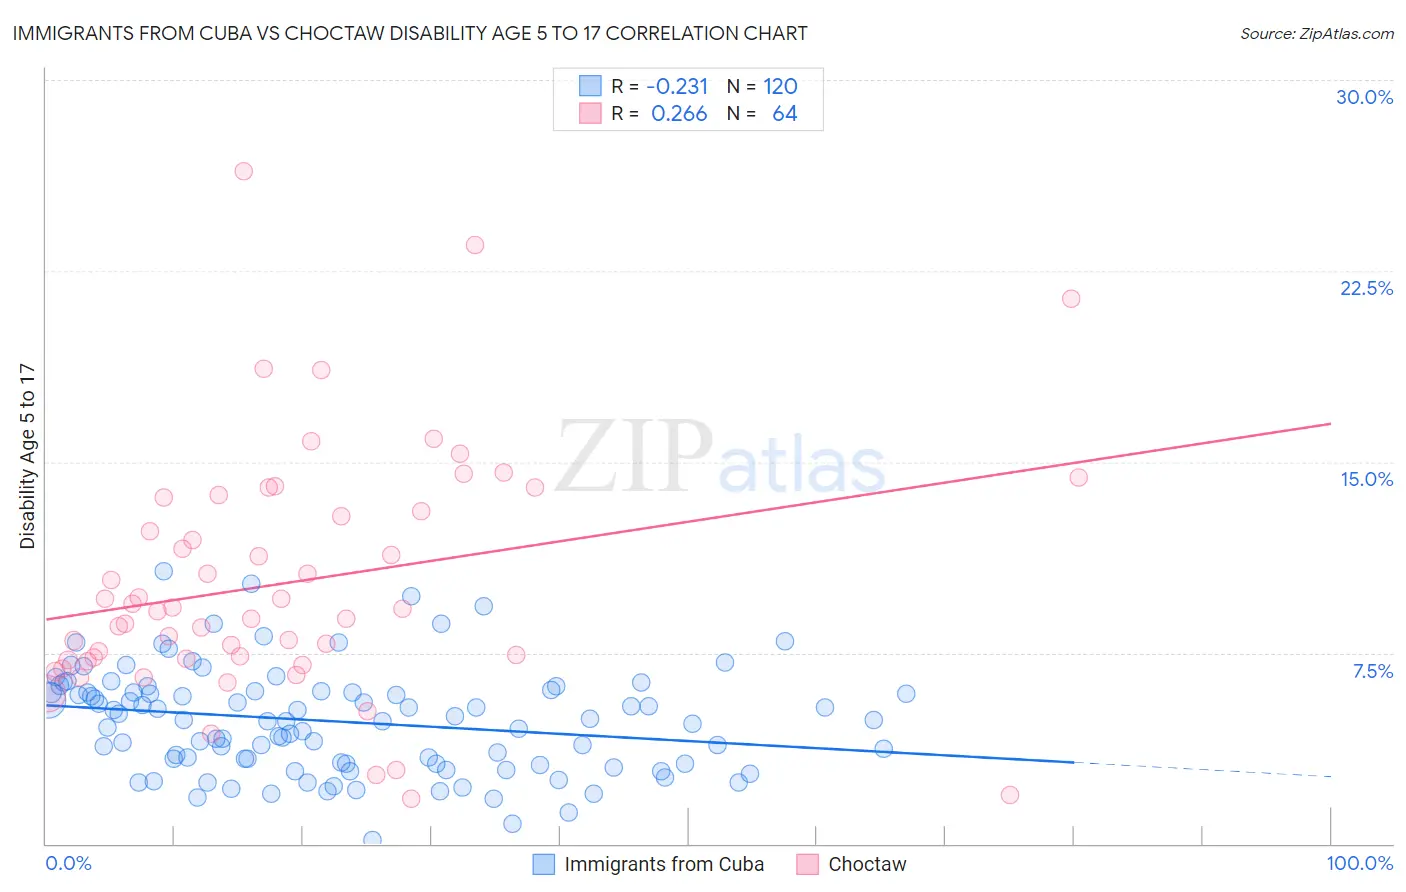
Immigrants from Cuba vs Choctaw Disability Age 5 to 17 Correlation Chart
The statistical analysis conducted on geographies consisting of 323,753,754 people shows a weak negative correlation between the proportion of Immigrants from Cuba and percentage of population with a disability between the ages 5 and 17 in the United States with a correlation coefficient (R) of -0.231 and weighted average of 5.2%. Similarly, the statistical analysis conducted on geographies consisting of 268,025,414 people shows a weak positive correlation between the proportion of Choctaw and percentage of population with a disability between the ages 5 and 17 in the United States with a correlation coefficient (R) of 0.266 and weighted average of 6.9%, a difference of 32.4%.
Disability Age 5 to 17 Correlation Summary
| Measurement | Immigrants from Cuba | Choctaw |
| Minimum | 0.17% | 1.8% |
| Maximum | 10.7% | 26.4% |
| Range | 10.6% | 24.6% |
| Mean | 4.8% | 10.3% |
| Median | 4.8% | 9.2% |
| Interquartile 25% (IQ1) | 3.2% | 7.2% |
| Interquartile 75% (IQ3) | 6.0% | 13.3% |
| Interquartile Range (IQR) | 2.8% | 6.1% |
| Standard Deviation (Sample) | 2.0% | 4.8% |
| Standard Deviation (Population) | 2.0% | 4.8% |
Similar Demographics by Disability Age 5 to 17
Demographics Similar to Immigrants from Cuba by Disability Age 5 to 17
In terms of disability age 5 to 17, the demographic groups most similar to Immigrants from Cuba are Immigrants from Kazakhstan (5.2%, a difference of 0.010%), Immigrants from Guyana (5.2%, a difference of 0.040%), Afghan (5.2%, a difference of 0.040%), Sri Lankan (5.2%, a difference of 0.060%), and Immigrants from Moldova (5.2%, a difference of 0.070%).
| Demographics | Rating | Rank | Disability Age 5 to 17 |
| Jordanians | 99.7 /100 | #71 | Exceptional 5.2% |
| Immigrants | Vietnam | 99.7 /100 | #72 | Exceptional 5.2% |
| Immigrants | Czechoslovakia | 99.7 /100 | #73 | Exceptional 5.2% |
| Immigrants | Romania | 99.7 /100 | #74 | Exceptional 5.2% |
| Immigrants | Moldova | 99.6 /100 | #75 | Exceptional 5.2% |
| Immigrants | Guyana | 99.6 /100 | #76 | Exceptional 5.2% |
| Immigrants | Kazakhstan | 99.6 /100 | #77 | Exceptional 5.2% |
| Immigrants | Cuba | 99.6 /100 | #78 | Exceptional 5.2% |
| Afghans | 99.6 /100 | #79 | Exceptional 5.2% |
| Sri Lankans | 99.6 /100 | #80 | Exceptional 5.2% |
| Native Hawaiians | 99.6 /100 | #81 | Exceptional 5.2% |
| Immigrants | Sweden | 99.5 /100 | #82 | Exceptional 5.2% |
| Immigrants | France | 99.5 /100 | #83 | Exceptional 5.2% |
| Immigrants | Nicaragua | 99.5 /100 | #84 | Exceptional 5.2% |
| Bulgarians | 99.4 /100 | #85 | Exceptional 5.2% |
Demographics Similar to Choctaw by Disability Age 5 to 17
In terms of disability age 5 to 17, the demographic groups most similar to Choctaw are Cherokee (6.9%, a difference of 0.26%), Iroquois (6.9%, a difference of 0.33%), Creek (6.9%, a difference of 0.57%), Cape Verdean (7.0%, a difference of 0.80%), and Chickasaw (6.8%, a difference of 1.0%).
| Demographics | Rating | Rank | Disability Age 5 to 17 |
| Immigrants | Azores | 0.0 /100 | #332 | Tragic 6.7% |
| Blacks/African Americans | 0.0 /100 | #333 | Tragic 6.8% |
| Seminole | 0.0 /100 | #334 | Tragic 6.8% |
| Ottawa | 0.0 /100 | #335 | Tragic 6.8% |
| Chickasaw | 0.0 /100 | #336 | Tragic 6.8% |
| Creek | 0.0 /100 | #337 | Tragic 6.9% |
| Iroquois | 0.0 /100 | #338 | Tragic 6.9% |
| Choctaw | 0.0 /100 | #339 | Tragic 6.9% |
| Cherokee | 0.0 /100 | #340 | Tragic 6.9% |
| Cape Verdeans | 0.0 /100 | #341 | Tragic 7.0% |
| Chippewa | 0.0 /100 | #342 | Tragic 7.1% |
| Immigrants | Cabo Verde | 0.0 /100 | #343 | Tragic 7.1% |
| Cajuns | 0.0 /100 | #344 | Tragic 7.2% |
| Tsimshian | 0.0 /100 | #345 | Tragic 7.9% |
| Puerto Ricans | 0.0 /100 | #346 | Tragic 8.3% |