Immigrants from Cuba vs Swiss Disability Age 5 to 17
COMPARE
Immigrants from Cuba
Swiss
Disability Age 5 to 17
Disability Age 5 to 17 Comparison
Immigrants from Cuba
Swiss
5.2%
DISABILITY AGE 5 TO 17
99.6/ 100
METRIC RATING
78th/ 347
METRIC RANK
5.8%
DISABILITY AGE 5 TO 17
5.1/ 100
METRIC RATING
227th/ 347
METRIC RANK
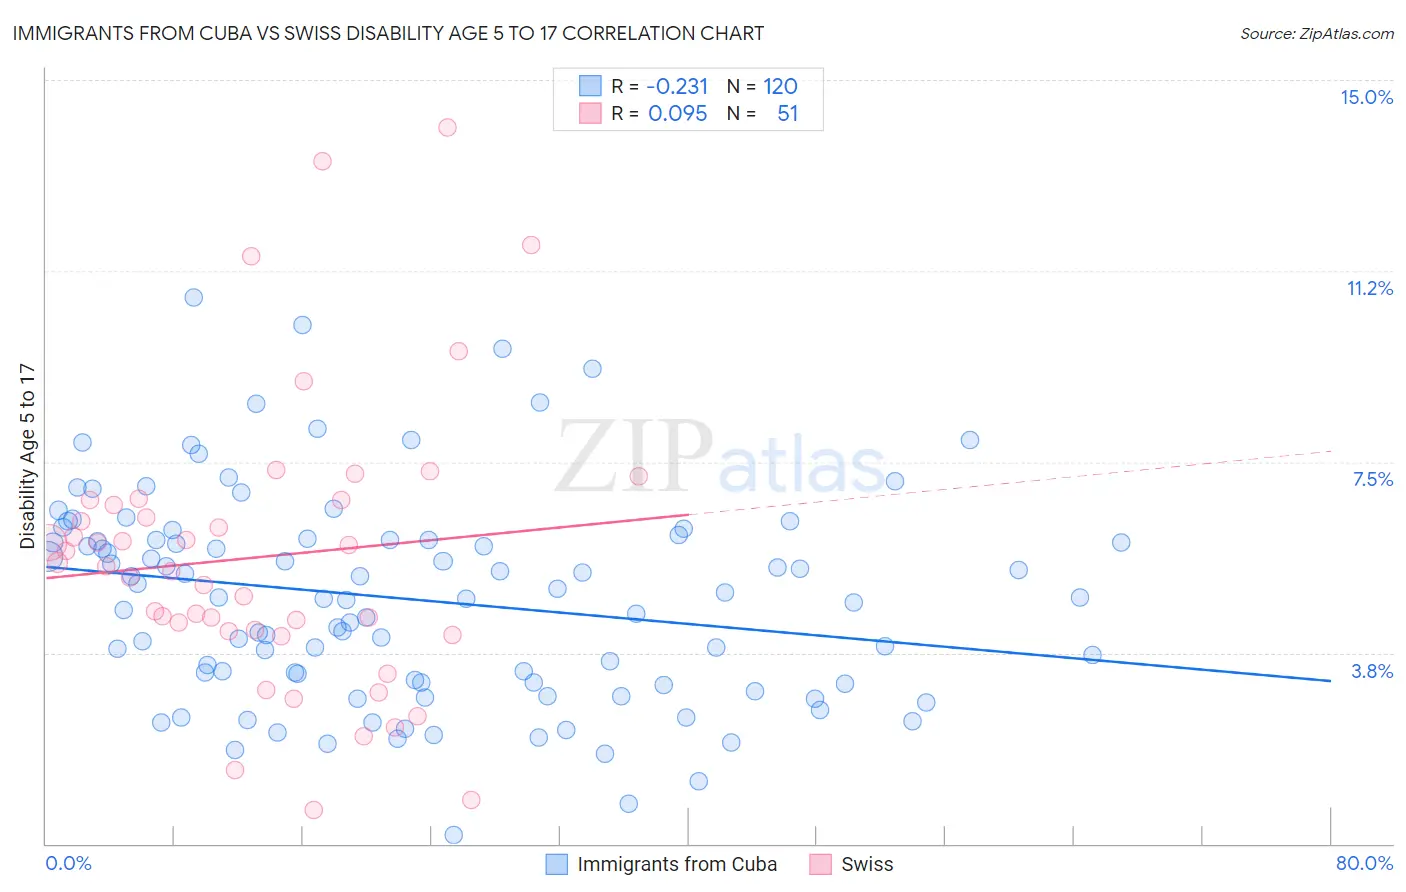
Immigrants from Cuba vs Swiss Disability Age 5 to 17 Correlation Chart
The statistical analysis conducted on geographies consisting of 323,753,754 people shows a weak negative correlation between the proportion of Immigrants from Cuba and percentage of population with a disability between the ages 5 and 17 in the United States with a correlation coefficient (R) of -0.231 and weighted average of 5.2%. Similarly, the statistical analysis conducted on geographies consisting of 458,460,312 people shows a slight positive correlation between the proportion of Swiss and percentage of population with a disability between the ages 5 and 17 in the United States with a correlation coefficient (R) of 0.095 and weighted average of 5.8%, a difference of 11.2%.
Disability Age 5 to 17 Correlation Summary
| Measurement | Immigrants from Cuba | Swiss |
| Minimum | 0.17% | 0.66% |
| Maximum | 10.7% | 14.1% |
| Range | 10.6% | 13.4% |
| Mean | 4.8% | 5.6% |
| Median | 4.8% | 5.4% |
| Interquartile 25% (IQ1) | 3.2% | 4.2% |
| Interquartile 75% (IQ3) | 6.0% | 6.7% |
| Interquartile Range (IQR) | 2.8% | 2.6% |
| Standard Deviation (Sample) | 2.0% | 2.8% |
| Standard Deviation (Population) | 2.0% | 2.8% |
Similar Demographics by Disability Age 5 to 17
Demographics Similar to Immigrants from Cuba by Disability Age 5 to 17
In terms of disability age 5 to 17, the demographic groups most similar to Immigrants from Cuba are Immigrants from Kazakhstan (5.2%, a difference of 0.010%), Immigrants from Guyana (5.2%, a difference of 0.040%), Afghan (5.2%, a difference of 0.040%), Sri Lankan (5.2%, a difference of 0.060%), and Immigrants from Moldova (5.2%, a difference of 0.070%).
| Demographics | Rating | Rank | Disability Age 5 to 17 |
| Jordanians | 99.7 /100 | #71 | Exceptional 5.2% |
| Immigrants | Vietnam | 99.7 /100 | #72 | Exceptional 5.2% |
| Immigrants | Czechoslovakia | 99.7 /100 | #73 | Exceptional 5.2% |
| Immigrants | Romania | 99.7 /100 | #74 | Exceptional 5.2% |
| Immigrants | Moldova | 99.6 /100 | #75 | Exceptional 5.2% |
| Immigrants | Guyana | 99.6 /100 | #76 | Exceptional 5.2% |
| Immigrants | Kazakhstan | 99.6 /100 | #77 | Exceptional 5.2% |
| Immigrants | Cuba | 99.6 /100 | #78 | Exceptional 5.2% |
| Afghans | 99.6 /100 | #79 | Exceptional 5.2% |
| Sri Lankans | 99.6 /100 | #80 | Exceptional 5.2% |
| Native Hawaiians | 99.6 /100 | #81 | Exceptional 5.2% |
| Immigrants | Sweden | 99.5 /100 | #82 | Exceptional 5.2% |
| Immigrants | France | 99.5 /100 | #83 | Exceptional 5.2% |
| Immigrants | Nicaragua | 99.5 /100 | #84 | Exceptional 5.2% |
| Bulgarians | 99.4 /100 | #85 | Exceptional 5.2% |
Demographics Similar to Swiss by Disability Age 5 to 17
In terms of disability age 5 to 17, the demographic groups most similar to Swiss are British West Indian (5.8%, a difference of 0.080%), Haitian (5.8%, a difference of 0.080%), Bangladeshi (5.8%, a difference of 0.090%), Ghanaian (5.8%, a difference of 0.10%), and Guamanian/Chamorro (5.8%, a difference of 0.12%).
| Demographics | Rating | Rank | Disability Age 5 to 17 |
| Belgians | 6.9 /100 | #220 | Tragic 5.8% |
| Lithuanians | 6.7 /100 | #221 | Tragic 5.8% |
| Immigrants | Sudan | 6.7 /100 | #222 | Tragic 5.8% |
| Alsatians | 6.0 /100 | #223 | Tragic 5.8% |
| Mexicans | 5.7 /100 | #224 | Tragic 5.8% |
| Guamanians/Chamorros | 5.6 /100 | #225 | Tragic 5.8% |
| British West Indians | 5.4 /100 | #226 | Tragic 5.8% |
| Swiss | 5.1 /100 | #227 | Tragic 5.8% |
| Haitians | 4.8 /100 | #228 | Tragic 5.8% |
| Bangladeshis | 4.8 /100 | #229 | Tragic 5.8% |
| Ghanaians | 4.7 /100 | #230 | Tragic 5.8% |
| Europeans | 4.5 /100 | #231 | Tragic 5.8% |
| Immigrants | Laos | 3.8 /100 | #232 | Tragic 5.8% |
| Immigrants | West Indies | 3.5 /100 | #233 | Tragic 5.8% |
| Immigrants | Kenya | 3.4 /100 | #234 | Tragic 5.8% |