Basque vs Immigrants from Japan Disability Age 5 to 17
COMPARE
Basque
Immigrants from Japan
Disability Age 5 to 17
Disability Age 5 to 17 Comparison
Basques
Immigrants from Japan
5.7%
DISABILITY AGE 5 TO 17
13.7/ 100
METRIC RATING
201st/ 347
METRIC RANK
4.9%
DISABILITY AGE 5 TO 17
100.0/ 100
METRIC RATING
28th/ 347
METRIC RANK
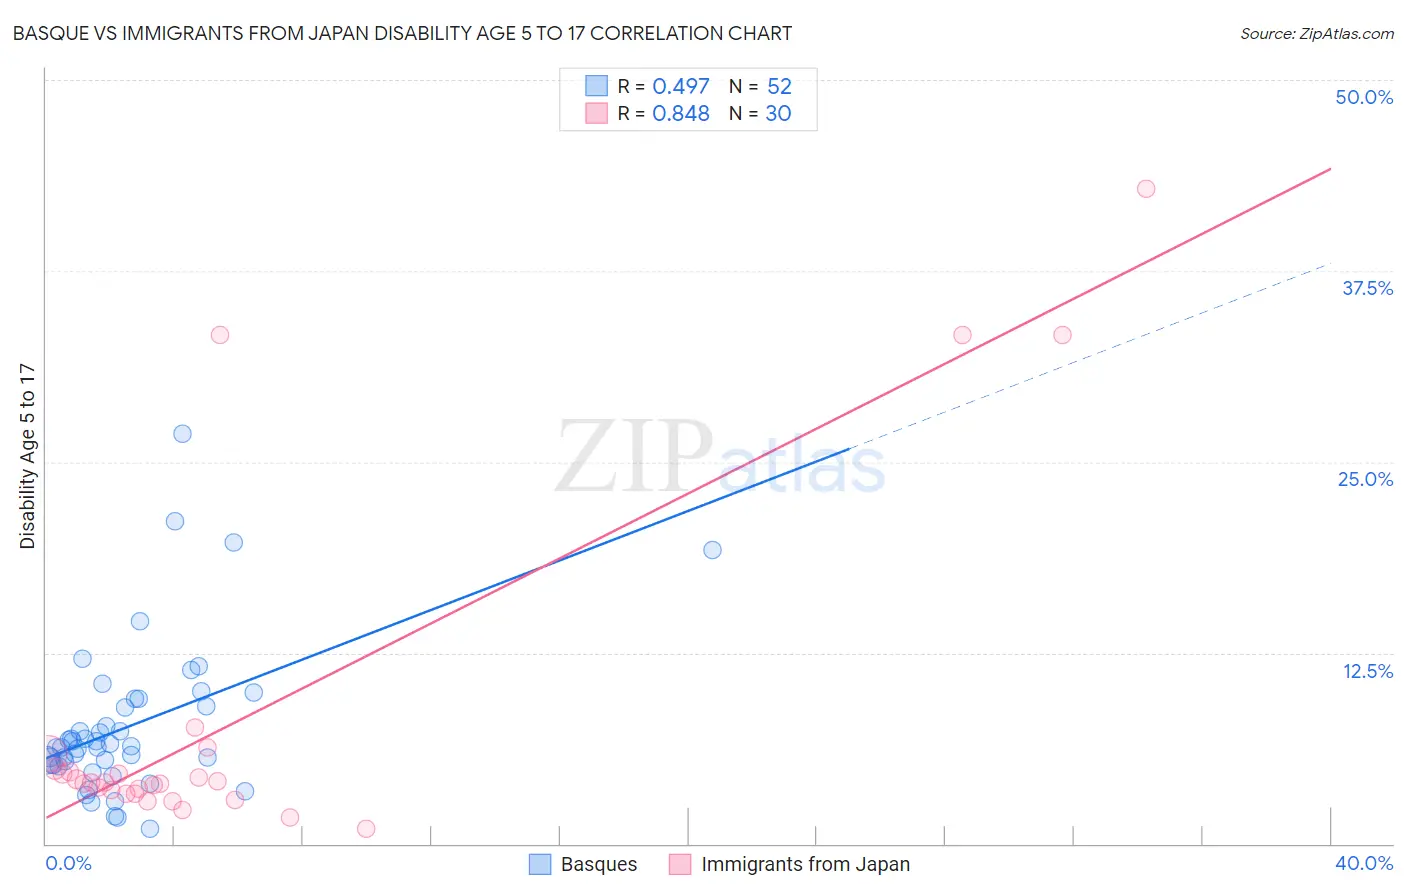
Basque vs Immigrants from Japan Disability Age 5 to 17 Correlation Chart
The statistical analysis conducted on geographies consisting of 165,145,807 people shows a moderate positive correlation between the proportion of Basques and percentage of population with a disability between the ages 5 and 17 in the United States with a correlation coefficient (R) of 0.497 and weighted average of 5.7%. Similarly, the statistical analysis conducted on geographies consisting of 337,854,464 people shows a very strong positive correlation between the proportion of Immigrants from Japan and percentage of population with a disability between the ages 5 and 17 in the United States with a correlation coefficient (R) of 0.848 and weighted average of 4.9%, a difference of 16.3%.
Disability Age 5 to 17 Correlation Summary
| Measurement | Basque | Immigrants from Japan |
| Minimum | 0.97% | 0.95% |
| Maximum | 26.8% | 42.9% |
| Range | 25.9% | 41.9% |
| Mean | 7.7% | 8.2% |
| Median | 6.4% | 4.0% |
| Interquartile 25% (IQ1) | 5.2% | 3.3% |
| Interquartile 75% (IQ3) | 9.2% | 4.9% |
| Interquartile Range (IQR) | 4.0% | 1.7% |
| Standard Deviation (Sample) | 5.0% | 11.2% |
| Standard Deviation (Population) | 4.9% | 11.0% |
Similar Demographics by Disability Age 5 to 17
Demographics Similar to Basques by Disability Age 5 to 17
In terms of disability age 5 to 17, the demographic groups most similar to Basques are Austrian (5.7%, a difference of 0.050%), Icelander (5.7%, a difference of 0.090%), Spanish American Indian (5.7%, a difference of 0.090%), Northern European (5.7%, a difference of 0.15%), and Paiute (5.7%, a difference of 0.27%).
| Demographics | Rating | Rank | Disability Age 5 to 17 |
| Croatians | 23.6 /100 | #194 | Fair 5.7% |
| Immigrants | Nigeria | 23.4 /100 | #195 | Fair 5.7% |
| Inupiat | 23.3 /100 | #196 | Fair 5.7% |
| Immigrants | North America | 23.1 /100 | #197 | Fair 5.7% |
| Norwegians | 20.9 /100 | #198 | Fair 5.7% |
| Northern Europeans | 15.2 /100 | #199 | Poor 5.7% |
| Icelanders | 14.6 /100 | #200 | Poor 5.7% |
| Basques | 13.7 /100 | #201 | Poor 5.7% |
| Austrians | 13.2 /100 | #202 | Poor 5.7% |
| Spanish American Indians | 12.8 /100 | #203 | Poor 5.7% |
| Paiute | 11.2 /100 | #204 | Poor 5.7% |
| Trinidadians and Tobagonians | 10.8 /100 | #205 | Poor 5.7% |
| Immigrants | Africa | 10.8 /100 | #206 | Poor 5.7% |
| Moroccans | 10.4 /100 | #207 | Poor 5.7% |
| Kenyans | 10.0 /100 | #208 | Poor 5.8% |
Demographics Similar to Immigrants from Japan by Disability Age 5 to 17
In terms of disability age 5 to 17, the demographic groups most similar to Immigrants from Japan are Taiwanese (4.9%, a difference of 0.080%), Immigrants from Serbia (4.9%, a difference of 0.48%), Bhutanese (4.9%, a difference of 0.64%), Immigrants from Malaysia (5.0%, a difference of 0.70%), and Immigrants from Pakistan (5.0%, a difference of 0.95%).
| Demographics | Rating | Rank | Disability Age 5 to 17 |
| Yup'ik | 100.0 /100 | #21 | Exceptional 4.8% |
| Asians | 100.0 /100 | #22 | Exceptional 4.8% |
| Immigrants | Bolivia | 100.0 /100 | #23 | Exceptional 4.8% |
| Immigrants | Lebanon | 100.0 /100 | #24 | Exceptional 4.8% |
| Immigrants | Asia | 100.0 /100 | #25 | Exceptional 4.8% |
| Bhutanese | 100.0 /100 | #26 | Exceptional 4.9% |
| Taiwanese | 100.0 /100 | #27 | Exceptional 4.9% |
| Immigrants | Japan | 100.0 /100 | #28 | Exceptional 4.9% |
| Immigrants | Serbia | 100.0 /100 | #29 | Exceptional 4.9% |
| Immigrants | Malaysia | 100.0 /100 | #30 | Exceptional 5.0% |
| Immigrants | Pakistan | 100.0 /100 | #31 | Exceptional 5.0% |
| Soviet Union | 100.0 /100 | #32 | Exceptional 5.0% |
| Immigrants | Indonesia | 100.0 /100 | #33 | Exceptional 5.0% |
| Israelis | 100.0 /100 | #34 | Exceptional 5.0% |
| Bolivians | 100.0 /100 | #35 | Exceptional 5.0% |