Immigrants from Nigeria vs Choctaw Disability Age 5 to 17
COMPARE
Immigrants from Nigeria
Choctaw
Disability Age 5 to 17
Disability Age 5 to 17 Comparison
Immigrants from Nigeria
Choctaw
5.7%
DISABILITY AGE 5 TO 17
23.4/ 100
METRIC RATING
195th/ 347
METRIC RANK
6.9%
DISABILITY AGE 5 TO 17
0.0/ 100
METRIC RATING
339th/ 347
METRIC RANK
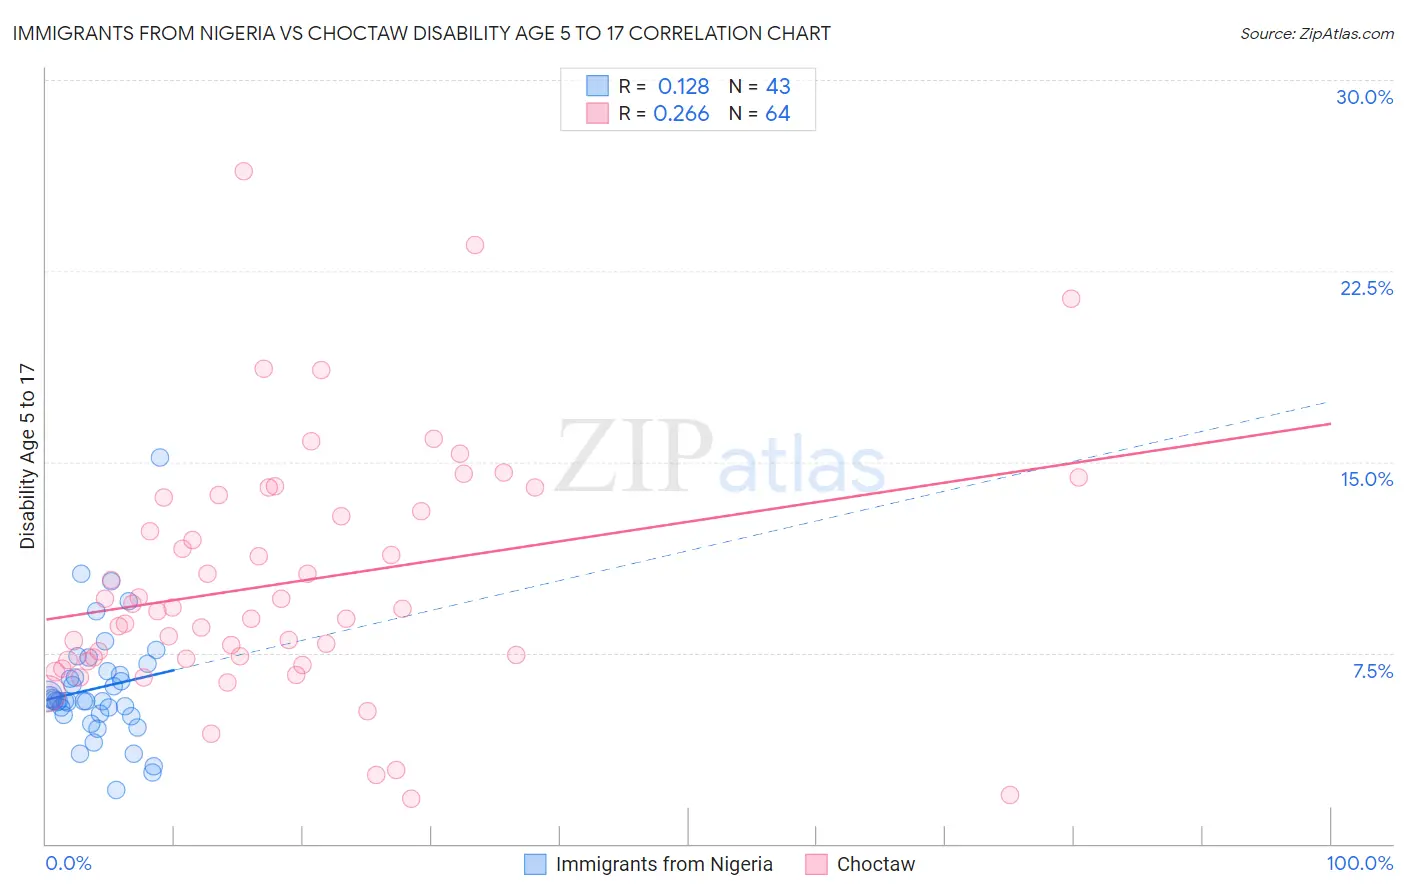
Immigrants from Nigeria vs Choctaw Disability Age 5 to 17 Correlation Chart
The statistical analysis conducted on geographies consisting of 282,146,479 people shows a poor positive correlation between the proportion of Immigrants from Nigeria and percentage of population with a disability between the ages 5 and 17 in the United States with a correlation coefficient (R) of 0.128 and weighted average of 5.7%. Similarly, the statistical analysis conducted on geographies consisting of 268,025,414 people shows a weak positive correlation between the proportion of Choctaw and percentage of population with a disability between the ages 5 and 17 in the United States with a correlation coefficient (R) of 0.266 and weighted average of 6.9%, a difference of 21.6%.
Disability Age 5 to 17 Correlation Summary
| Measurement | Immigrants from Nigeria | Choctaw |
| Minimum | 2.1% | 1.8% |
| Maximum | 15.2% | 26.4% |
| Range | 13.1% | 24.6% |
| Mean | 6.1% | 10.3% |
| Median | 5.6% | 9.2% |
| Interquartile 25% (IQ1) | 5.0% | 7.2% |
| Interquartile 75% (IQ3) | 6.8% | 13.3% |
| Interquartile Range (IQR) | 1.7% | 6.1% |
| Standard Deviation (Sample) | 2.3% | 4.8% |
| Standard Deviation (Population) | 2.3% | 4.8% |
Similar Demographics by Disability Age 5 to 17
Demographics Similar to Immigrants from Nigeria by Disability Age 5 to 17
In terms of disability age 5 to 17, the demographic groups most similar to Immigrants from Nigeria are Croatian (5.7%, a difference of 0.010%), Inupiat (5.7%, a difference of 0.010%), Immigrants from North America (5.7%, a difference of 0.020%), Immigrants from Canada (5.7%, a difference of 0.17%), and Norwegian (5.7%, a difference of 0.18%).
| Demographics | Rating | Rank | Disability Age 5 to 17 |
| Marshallese | 28.1 /100 | #188 | Fair 5.7% |
| Pueblo | 27.5 /100 | #189 | Fair 5.7% |
| Immigrants | Eastern Africa | 27.3 /100 | #190 | Fair 5.7% |
| Danes | 26.5 /100 | #191 | Fair 5.7% |
| Immigrants | Bosnia and Herzegovina | 26.3 /100 | #192 | Fair 5.7% |
| Immigrants | Canada | 26.1 /100 | #193 | Fair 5.7% |
| Croatians | 23.6 /100 | #194 | Fair 5.7% |
| Immigrants | Nigeria | 23.4 /100 | #195 | Fair 5.7% |
| Inupiat | 23.3 /100 | #196 | Fair 5.7% |
| Immigrants | North America | 23.1 /100 | #197 | Fair 5.7% |
| Norwegians | 20.9 /100 | #198 | Fair 5.7% |
| Northern Europeans | 15.2 /100 | #199 | Poor 5.7% |
| Icelanders | 14.6 /100 | #200 | Poor 5.7% |
| Basques | 13.7 /100 | #201 | Poor 5.7% |
| Austrians | 13.2 /100 | #202 | Poor 5.7% |
Demographics Similar to Choctaw by Disability Age 5 to 17
In terms of disability age 5 to 17, the demographic groups most similar to Choctaw are Cherokee (6.9%, a difference of 0.26%), Iroquois (6.9%, a difference of 0.33%), Creek (6.9%, a difference of 0.57%), Cape Verdean (7.0%, a difference of 0.80%), and Chickasaw (6.8%, a difference of 1.0%).
| Demographics | Rating | Rank | Disability Age 5 to 17 |
| Immigrants | Azores | 0.0 /100 | #332 | Tragic 6.7% |
| Blacks/African Americans | 0.0 /100 | #333 | Tragic 6.8% |
| Seminole | 0.0 /100 | #334 | Tragic 6.8% |
| Ottawa | 0.0 /100 | #335 | Tragic 6.8% |
| Chickasaw | 0.0 /100 | #336 | Tragic 6.8% |
| Creek | 0.0 /100 | #337 | Tragic 6.9% |
| Iroquois | 0.0 /100 | #338 | Tragic 6.9% |
| Choctaw | 0.0 /100 | #339 | Tragic 6.9% |
| Cherokee | 0.0 /100 | #340 | Tragic 6.9% |
| Cape Verdeans | 0.0 /100 | #341 | Tragic 7.0% |
| Chippewa | 0.0 /100 | #342 | Tragic 7.1% |
| Immigrants | Cabo Verde | 0.0 /100 | #343 | Tragic 7.1% |
| Cajuns | 0.0 /100 | #344 | Tragic 7.2% |
| Tsimshian | 0.0 /100 | #345 | Tragic 7.9% |
| Puerto Ricans | 0.0 /100 | #346 | Tragic 8.3% |