Immigrants from Cuba vs Canadian Hearing Disability
COMPARE
Immigrants from Cuba
Canadian
Hearing Disability
Hearing Disability Comparison
Immigrants from Cuba
Canadians
2.7%
HEARING DISABILITY
97.2/ 100
METRIC RATING
83rd/ 347
METRIC RANK
3.5%
HEARING DISABILITY
0.1/ 100
METRIC RATING
267th/ 347
METRIC RANK
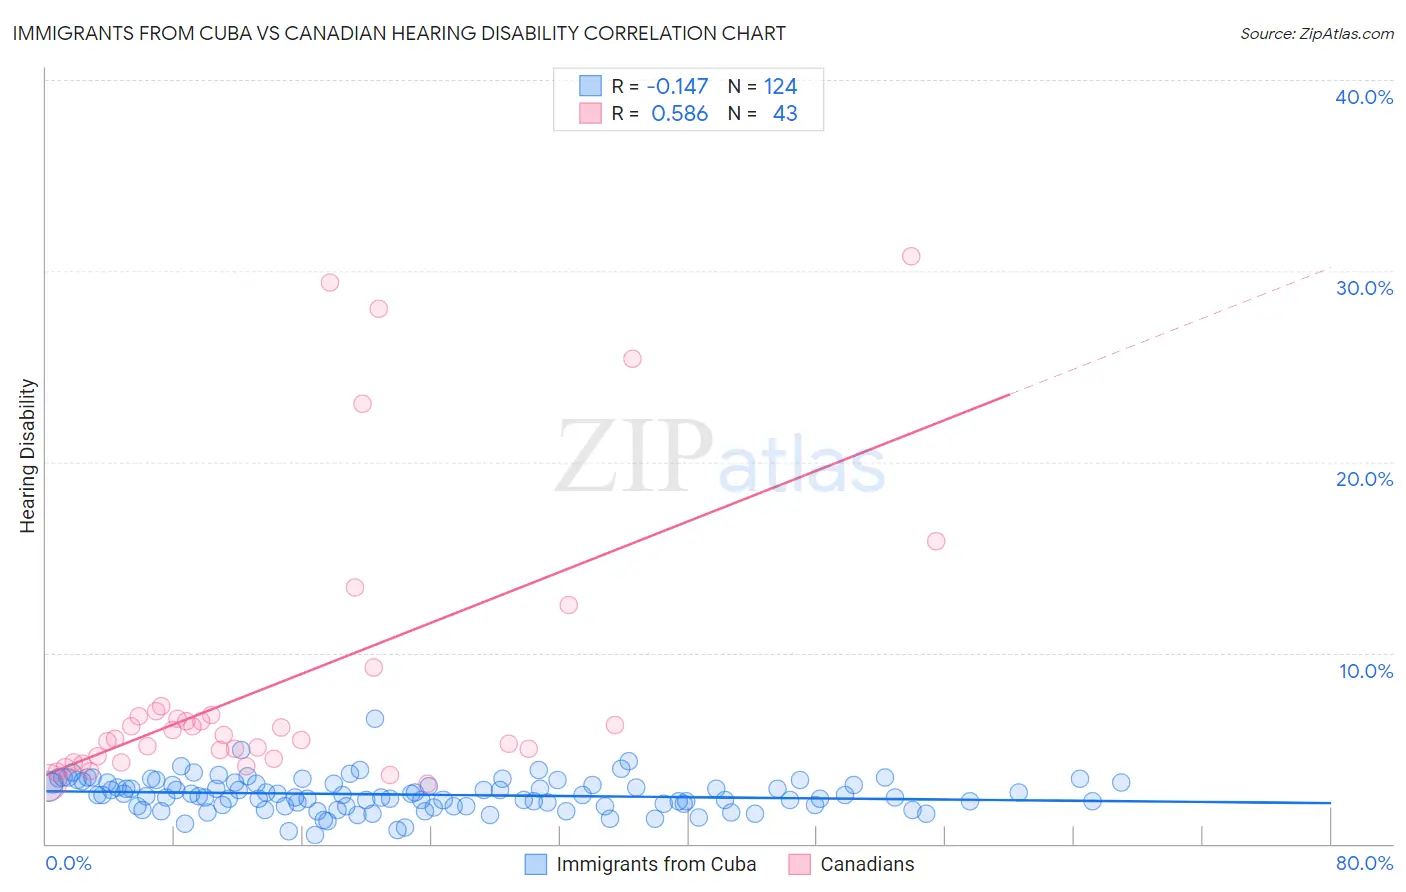
Immigrants from Cuba vs Canadian Hearing Disability Correlation Chart
The statistical analysis conducted on geographies consisting of 325,940,819 people shows a poor negative correlation between the proportion of Immigrants from Cuba and percentage of population with hearing disability in the United States with a correlation coefficient (R) of -0.147 and weighted average of 2.7%. Similarly, the statistical analysis conducted on geographies consisting of 437,359,383 people shows a substantial positive correlation between the proportion of Canadians and percentage of population with hearing disability in the United States with a correlation coefficient (R) of 0.586 and weighted average of 3.5%, a difference of 27.0%.
Hearing Disability Correlation Summary
| Measurement | Immigrants from Cuba | Canadian |
| Minimum | 0.47% | 3.1% |
| Maximum | 6.5% | 30.8% |
| Range | 6.1% | 27.6% |
| Mean | 2.6% | 8.5% |
| Median | 2.5% | 5.7% |
| Interquartile 25% (IQ1) | 2.0% | 4.4% |
| Interquartile 75% (IQ3) | 3.2% | 6.9% |
| Interquartile Range (IQR) | 1.2% | 2.5% |
| Standard Deviation (Sample) | 0.88% | 7.4% |
| Standard Deviation (Population) | 0.88% | 7.3% |
Similar Demographics by Hearing Disability
Demographics Similar to Immigrants from Cuba by Hearing Disability
In terms of hearing disability, the demographic groups most similar to Immigrants from Cuba are Immigrants from Armenia (2.7%, a difference of 0.020%), Immigrants from Uruguay (2.7%, a difference of 0.030%), Immigrants from Asia (2.7%, a difference of 0.060%), Immigrants from Argentina (2.8%, a difference of 0.19%), and Colombian (2.7%, a difference of 0.25%).
| Demographics | Rating | Rank | Hearing Disability |
| Asians | 97.5 /100 | #76 | Exceptional 2.7% |
| Immigrants | Malaysia | 97.5 /100 | #77 | Exceptional 2.7% |
| Mongolians | 97.4 /100 | #78 | Exceptional 2.7% |
| Colombians | 97.4 /100 | #79 | Exceptional 2.7% |
| Immigrants | Asia | 97.2 /100 | #80 | Exceptional 2.7% |
| Immigrants | Uruguay | 97.2 /100 | #81 | Exceptional 2.7% |
| Immigrants | Armenia | 97.2 /100 | #82 | Exceptional 2.7% |
| Immigrants | Cuba | 97.2 /100 | #83 | Exceptional 2.7% |
| Immigrants | Argentina | 97.0 /100 | #84 | Exceptional 2.8% |
| Immigrants | Northern Africa | 96.9 /100 | #85 | Exceptional 2.8% |
| Immigrants | Iran | 96.8 /100 | #86 | Exceptional 2.8% |
| Somalis | 96.7 /100 | #87 | Exceptional 2.8% |
| Immigrants | Turkey | 96.7 /100 | #88 | Exceptional 2.8% |
| Belizeans | 96.6 /100 | #89 | Exceptional 2.8% |
| Immigrants | Morocco | 96.6 /100 | #90 | Exceptional 2.8% |
Demographics Similar to Canadians by Hearing Disability
In terms of hearing disability, the demographic groups most similar to Canadians are Spaniard (3.5%, a difference of 0.020%), Belgian (3.5%, a difference of 0.22%), Ute (3.5%, a difference of 0.32%), British (3.5%, a difference of 0.40%), and Immigrants from Germany (3.5%, a difference of 0.42%).
| Demographics | Rating | Rank | Hearing Disability |
| Portuguese | 0.1 /100 | #260 | Tragic 3.5% |
| Hawaiians | 0.1 /100 | #261 | Tragic 3.5% |
| Immigrants | North America | 0.1 /100 | #262 | Tragic 3.5% |
| Immigrants | Canada | 0.1 /100 | #263 | Tragic 3.5% |
| Immigrants | Germany | 0.1 /100 | #264 | Tragic 3.5% |
| British | 0.1 /100 | #265 | Tragic 3.5% |
| Belgians | 0.1 /100 | #266 | Tragic 3.5% |
| Canadians | 0.1 /100 | #267 | Tragic 3.5% |
| Spaniards | 0.1 /100 | #268 | Tragic 3.5% |
| Ute | 0.1 /100 | #269 | Tragic 3.5% |
| Europeans | 0.1 /100 | #270 | Tragic 3.5% |
| Czechs | 0.1 /100 | #271 | Tragic 3.5% |
| Fijians | 0.0 /100 | #272 | Tragic 3.5% |
| Puerto Ricans | 0.0 /100 | #273 | Tragic 3.5% |
| Swiss | 0.0 /100 | #274 | Tragic 3.5% |