Immigrants from Costa Rica vs Dutch West Indian Male Disability
COMPARE
Immigrants from Costa Rica
Dutch West Indian
Male Disability
Male Disability Comparison
Immigrants from Costa Rica
Dutch West Indians
11.0%
MALE DISABILITY
82.8/ 100
METRIC RATING
136th/ 347
METRIC RANK
14.8%
MALE DISABILITY
0.0/ 100
METRIC RATING
335th/ 347
METRIC RANK
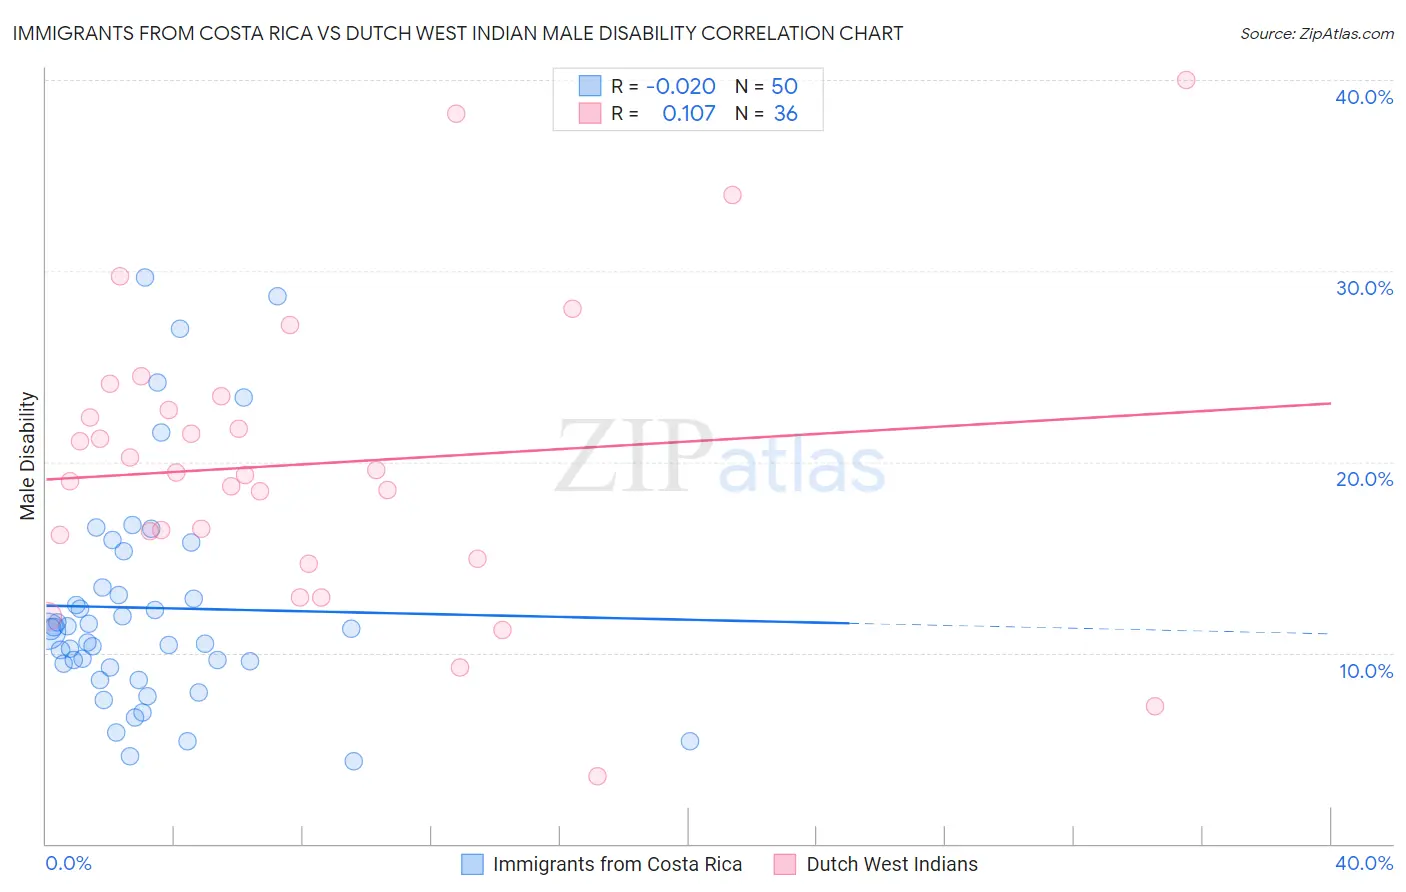
Immigrants from Costa Rica vs Dutch West Indian Male Disability Correlation Chart
The statistical analysis conducted on geographies consisting of 204,275,290 people shows no correlation between the proportion of Immigrants from Costa Rica and percentage of males with a disability in the United States with a correlation coefficient (R) of -0.020 and weighted average of 11.0%. Similarly, the statistical analysis conducted on geographies consisting of 85,765,735 people shows a poor positive correlation between the proportion of Dutch West Indians and percentage of males with a disability in the United States with a correlation coefficient (R) of 0.107 and weighted average of 14.8%, a difference of 35.2%.
Male Disability Correlation Summary
| Measurement | Immigrants from Costa Rica | Dutch West Indian |
| Minimum | 4.3% | 3.5% |
| Maximum | 29.6% | 40.0% |
| Range | 25.3% | 36.5% |
| Mean | 12.4% | 19.9% |
| Median | 11.2% | 19.4% |
| Interquartile 25% (IQ1) | 9.2% | 15.5% |
| Interquartile 75% (IQ3) | 13.4% | 23.1% |
| Interquartile Range (IQR) | 4.2% | 7.5% |
| Standard Deviation (Sample) | 5.9% | 7.8% |
| Standard Deviation (Population) | 5.9% | 7.7% |
Similar Demographics by Male Disability
Demographics Similar to Immigrants from Costa Rica by Male Disability
In terms of male disability, the demographic groups most similar to Immigrants from Costa Rica are Trinidadian and Tobagonian (11.0%, a difference of 0.040%), Bhutanese (11.0%, a difference of 0.060%), Immigrants from Europe (11.0%, a difference of 0.080%), Nigerian (11.0%, a difference of 0.090%), and Ugandan (11.0%, a difference of 0.11%).
| Demographics | Rating | Rank | Male Disability |
| Immigrants | Philippines | 85.4 /100 | #129 | Excellent 10.9% |
| Brazilians | 85.4 /100 | #130 | Excellent 10.9% |
| Macedonians | 84.2 /100 | #131 | Excellent 11.0% |
| Immigrants | Fiji | 84.0 /100 | #132 | Excellent 11.0% |
| Ugandans | 83.9 /100 | #133 | Excellent 11.0% |
| Bhutanese | 83.4 /100 | #134 | Excellent 11.0% |
| Trinidadians and Tobagonians | 83.3 /100 | #135 | Excellent 11.0% |
| Immigrants | Costa Rica | 82.8 /100 | #136 | Excellent 11.0% |
| Immigrants | Europe | 82.0 /100 | #137 | Excellent 11.0% |
| Nigerians | 81.9 /100 | #138 | Excellent 11.0% |
| South Africans | 81.7 /100 | #139 | Excellent 11.0% |
| Immigrants | Italy | 81.5 /100 | #140 | Excellent 11.0% |
| Arabs | 81.5 /100 | #141 | Excellent 11.0% |
| Immigrants | Sudan | 81.5 /100 | #142 | Excellent 11.0% |
| Moroccans | 80.7 /100 | #143 | Excellent 11.0% |
Demographics Similar to Dutch West Indians by Male Disability
In terms of male disability, the demographic groups most similar to Dutch West Indians are Cherokee (14.8%, a difference of 0.020%), Alaskan Athabascan (14.9%, a difference of 0.46%), Yuman (14.7%, a difference of 0.70%), Seminole (14.7%, a difference of 0.80%), and Menominee (15.0%, a difference of 0.97%).
| Demographics | Rating | Rank | Male Disability |
| Chippewa | 0.0 /100 | #328 | Tragic 14.3% |
| Cajuns | 0.0 /100 | #329 | Tragic 14.4% |
| Navajo | 0.0 /100 | #330 | Tragic 14.4% |
| Tohono O'odham | 0.0 /100 | #331 | Tragic 14.6% |
| Seminole | 0.0 /100 | #332 | Tragic 14.7% |
| Yuman | 0.0 /100 | #333 | Tragic 14.7% |
| Cherokee | 0.0 /100 | #334 | Tragic 14.8% |
| Dutch West Indians | 0.0 /100 | #335 | Tragic 14.8% |
| Alaskan Athabascans | 0.0 /100 | #336 | Tragic 14.9% |
| Menominee | 0.0 /100 | #337 | Tragic 15.0% |
| Pueblo | 0.0 /100 | #338 | Tragic 15.0% |
| Chickasaw | 0.0 /100 | #339 | Tragic 15.1% |
| Lumbee | 0.0 /100 | #340 | Tragic 15.2% |
| Choctaw | 0.0 /100 | #341 | Tragic 15.4% |
| Kiowa | 0.0 /100 | #342 | Tragic 15.4% |