Assyrian/Chaldean/Syriac vs Dutch West Indian Male Disability
COMPARE
Assyrian/Chaldean/Syriac
Dutch West Indian
Male Disability
Male Disability Comparison
Assyrians/Chaldeans/Syriacs
Dutch West Indians
11.4%
MALE DISABILITY
23.2/ 100
METRIC RATING
192nd/ 347
METRIC RANK
14.8%
MALE DISABILITY
0.0/ 100
METRIC RATING
335th/ 347
METRIC RANK
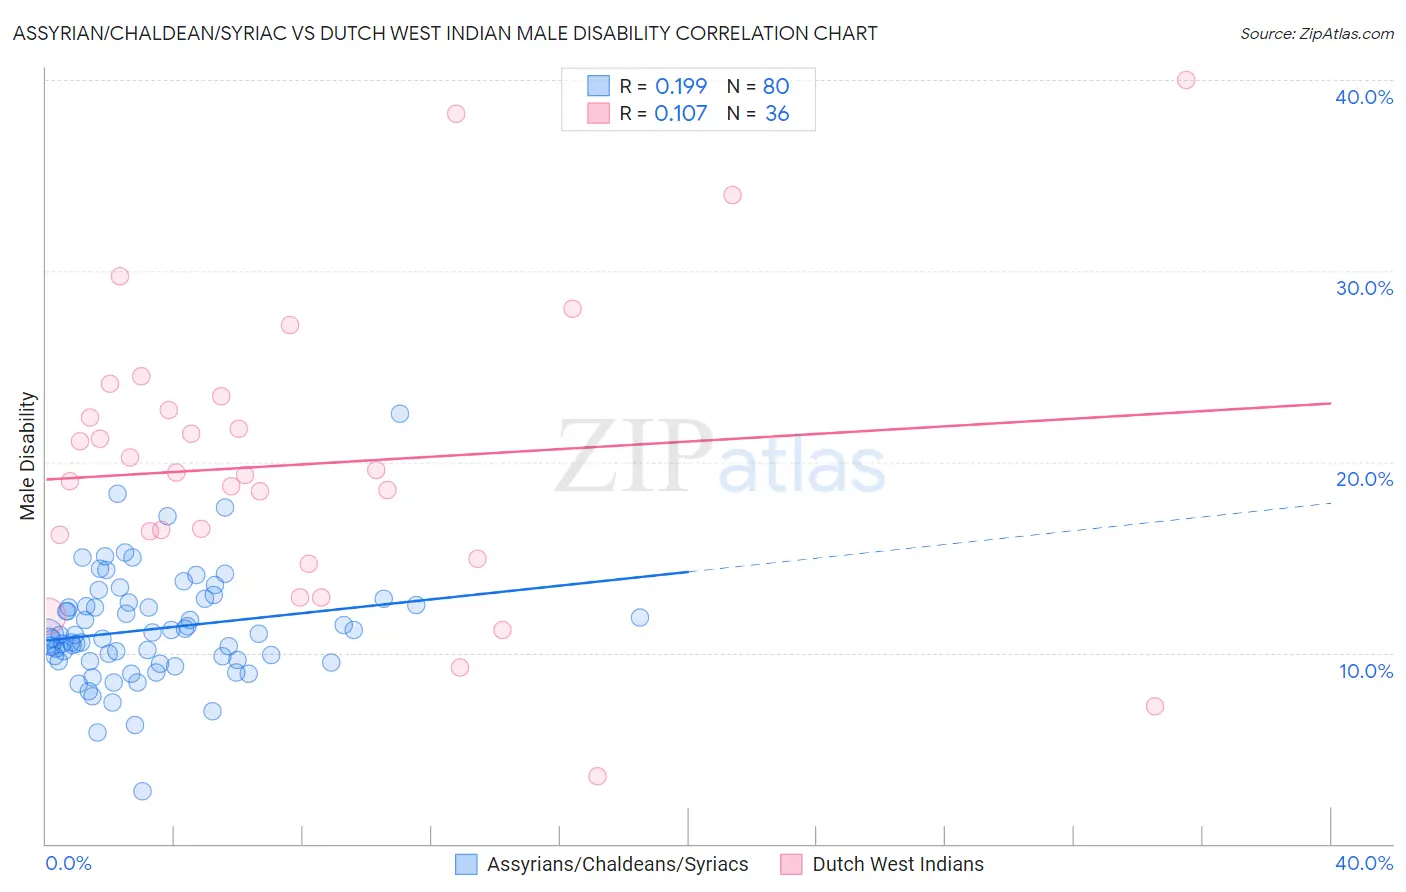
Assyrian/Chaldean/Syriac vs Dutch West Indian Male Disability Correlation Chart
The statistical analysis conducted on geographies consisting of 110,312,508 people shows a poor positive correlation between the proportion of Assyrians/Chaldeans/Syriacs and percentage of males with a disability in the United States with a correlation coefficient (R) of 0.199 and weighted average of 11.4%. Similarly, the statistical analysis conducted on geographies consisting of 85,765,735 people shows a poor positive correlation between the proportion of Dutch West Indians and percentage of males with a disability in the United States with a correlation coefficient (R) of 0.107 and weighted average of 14.8%, a difference of 30.1%.
Male Disability Correlation Summary
| Measurement | Assyrian/Chaldean/Syriac | Dutch West Indian |
| Minimum | 2.8% | 3.5% |
| Maximum | 22.5% | 40.0% |
| Range | 19.7% | 36.5% |
| Mean | 11.3% | 19.9% |
| Median | 10.9% | 19.4% |
| Interquartile 25% (IQ1) | 9.6% | 15.5% |
| Interquartile 75% (IQ3) | 12.6% | 23.1% |
| Interquartile Range (IQR) | 3.0% | 7.5% |
| Standard Deviation (Sample) | 2.9% | 7.8% |
| Standard Deviation (Population) | 2.9% | 7.7% |
Similar Demographics by Male Disability
Demographics Similar to Assyrians/Chaldeans/Syriacs by Male Disability
In terms of male disability, the demographic groups most similar to Assyrians/Chaldeans/Syriacs are Senegalese (11.4%, a difference of 0.0%), Greek (11.4%, a difference of 0.070%), Belizean (11.4%, a difference of 0.15%), Immigrants from Bosnia and Herzegovina (11.4%, a difference of 0.16%), and Immigrants from Oceania (11.4%, a difference of 0.18%).
| Demographics | Rating | Rank | Male Disability |
| Pakistanis | 30.3 /100 | #185 | Fair 11.3% |
| Immigrants | Zaire | 27.6 /100 | #186 | Fair 11.4% |
| Immigrants | Austria | 27.3 /100 | #187 | Fair 11.4% |
| Estonians | 26.8 /100 | #188 | Fair 11.4% |
| Immigrants | Netherlands | 25.9 /100 | #189 | Fair 11.4% |
| Immigrants | Bosnia and Herzegovina | 25.4 /100 | #190 | Fair 11.4% |
| Senegalese | 23.2 /100 | #191 | Fair 11.4% |
| Assyrians/Chaldeans/Syriacs | 23.2 /100 | #192 | Fair 11.4% |
| Greeks | 22.2 /100 | #193 | Fair 11.4% |
| Belizeans | 21.2 /100 | #194 | Fair 11.4% |
| Immigrants | Oceania | 20.9 /100 | #195 | Fair 11.4% |
| West Indians | 18.4 /100 | #196 | Poor 11.4% |
| Somalis | 18.2 /100 | #197 | Poor 11.4% |
| Immigrants | Jamaica | 16.3 /100 | #198 | Poor 11.5% |
| Lebanese | 15.4 /100 | #199 | Poor 11.5% |
Demographics Similar to Dutch West Indians by Male Disability
In terms of male disability, the demographic groups most similar to Dutch West Indians are Cherokee (14.8%, a difference of 0.020%), Alaskan Athabascan (14.9%, a difference of 0.46%), Yuman (14.7%, a difference of 0.70%), Seminole (14.7%, a difference of 0.80%), and Menominee (15.0%, a difference of 0.97%).
| Demographics | Rating | Rank | Male Disability |
| Chippewa | 0.0 /100 | #328 | Tragic 14.3% |
| Cajuns | 0.0 /100 | #329 | Tragic 14.4% |
| Navajo | 0.0 /100 | #330 | Tragic 14.4% |
| Tohono O'odham | 0.0 /100 | #331 | Tragic 14.6% |
| Seminole | 0.0 /100 | #332 | Tragic 14.7% |
| Yuman | 0.0 /100 | #333 | Tragic 14.7% |
| Cherokee | 0.0 /100 | #334 | Tragic 14.8% |
| Dutch West Indians | 0.0 /100 | #335 | Tragic 14.8% |
| Alaskan Athabascans | 0.0 /100 | #336 | Tragic 14.9% |
| Menominee | 0.0 /100 | #337 | Tragic 15.0% |
| Pueblo | 0.0 /100 | #338 | Tragic 15.0% |
| Chickasaw | 0.0 /100 | #339 | Tragic 15.1% |
| Lumbee | 0.0 /100 | #340 | Tragic 15.2% |
| Choctaw | 0.0 /100 | #341 | Tragic 15.4% |
| Kiowa | 0.0 /100 | #342 | Tragic 15.4% |