Immigrants from Costa Rica vs Arapaho Male Disability
COMPARE
Immigrants from Costa Rica
Arapaho
Male Disability
Male Disability Comparison
Immigrants from Costa Rica
Arapaho
11.0%
MALE DISABILITY
82.8/ 100
METRIC RATING
136th/ 347
METRIC RANK
13.3%
MALE DISABILITY
0.0/ 100
METRIC RATING
307th/ 347
METRIC RANK
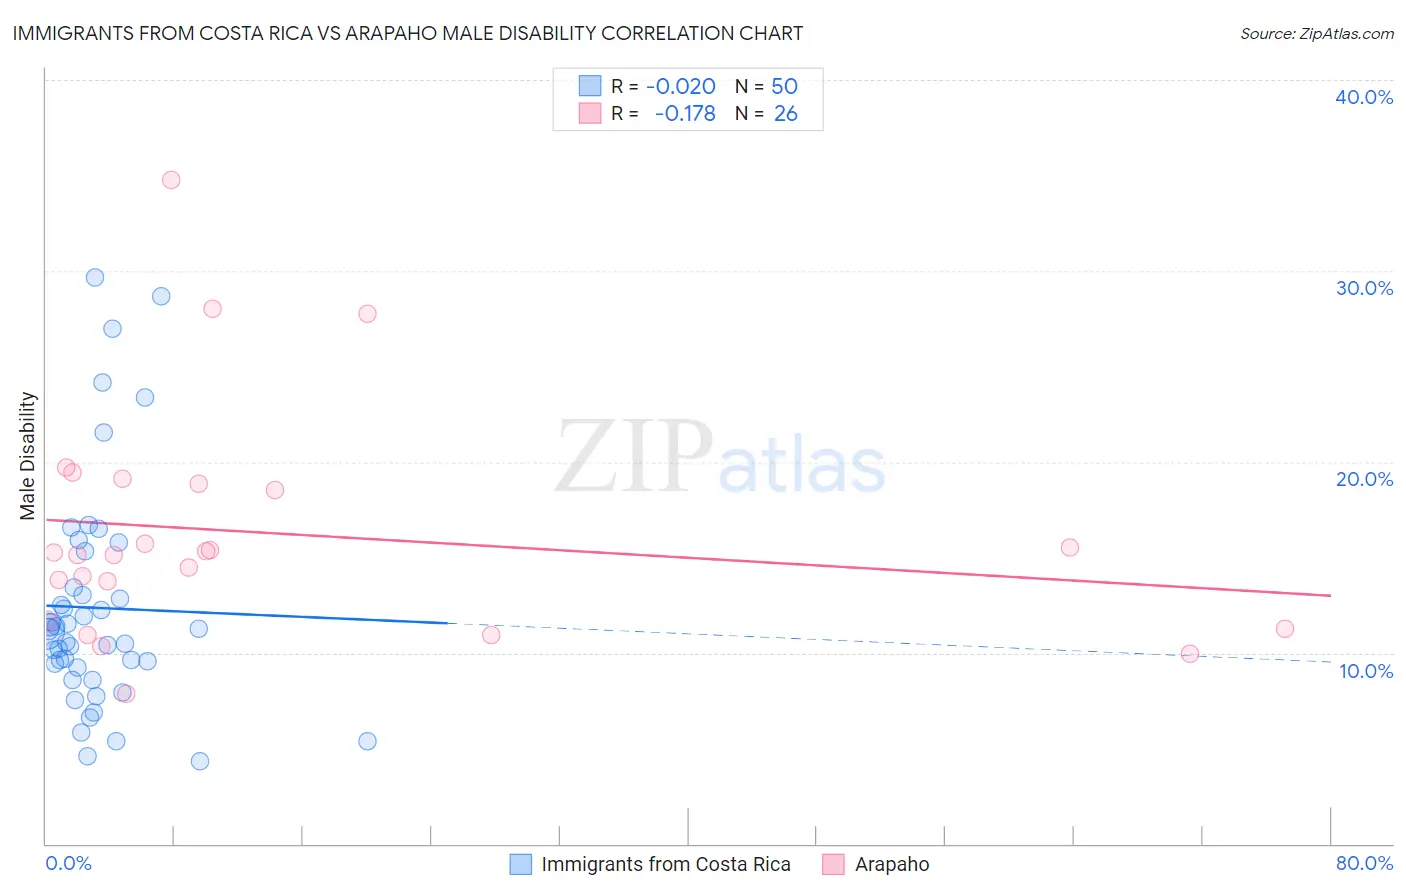
Immigrants from Costa Rica vs Arapaho Male Disability Correlation Chart
The statistical analysis conducted on geographies consisting of 204,275,290 people shows no correlation between the proportion of Immigrants from Costa Rica and percentage of males with a disability in the United States with a correlation coefficient (R) of -0.020 and weighted average of 11.0%. Similarly, the statistical analysis conducted on geographies consisting of 29,780,236 people shows a poor negative correlation between the proportion of Arapaho and percentage of males with a disability in the United States with a correlation coefficient (R) of -0.178 and weighted average of 13.3%, a difference of 21.6%.
Male Disability Correlation Summary
| Measurement | Immigrants from Costa Rica | Arapaho |
| Minimum | 4.3% | 7.9% |
| Maximum | 29.6% | 34.7% |
| Range | 25.3% | 26.9% |
| Mean | 12.4% | 16.3% |
| Median | 11.2% | 15.2% |
| Interquartile 25% (IQ1) | 9.2% | 11.6% |
| Interquartile 75% (IQ3) | 13.4% | 18.8% |
| Interquartile Range (IQR) | 4.2% | 7.2% |
| Standard Deviation (Sample) | 5.9% | 6.1% |
| Standard Deviation (Population) | 5.9% | 6.0% |
Similar Demographics by Male Disability
Demographics Similar to Immigrants from Costa Rica by Male Disability
In terms of male disability, the demographic groups most similar to Immigrants from Costa Rica are Trinidadian and Tobagonian (11.0%, a difference of 0.040%), Bhutanese (11.0%, a difference of 0.060%), Immigrants from Europe (11.0%, a difference of 0.080%), Nigerian (11.0%, a difference of 0.090%), and Ugandan (11.0%, a difference of 0.11%).
| Demographics | Rating | Rank | Male Disability |
| Immigrants | Philippines | 85.4 /100 | #129 | Excellent 10.9% |
| Brazilians | 85.4 /100 | #130 | Excellent 10.9% |
| Macedonians | 84.2 /100 | #131 | Excellent 11.0% |
| Immigrants | Fiji | 84.0 /100 | #132 | Excellent 11.0% |
| Ugandans | 83.9 /100 | #133 | Excellent 11.0% |
| Bhutanese | 83.4 /100 | #134 | Excellent 11.0% |
| Trinidadians and Tobagonians | 83.3 /100 | #135 | Excellent 11.0% |
| Immigrants | Costa Rica | 82.8 /100 | #136 | Excellent 11.0% |
| Immigrants | Europe | 82.0 /100 | #137 | Excellent 11.0% |
| Nigerians | 81.9 /100 | #138 | Excellent 11.0% |
| South Africans | 81.7 /100 | #139 | Excellent 11.0% |
| Immigrants | Italy | 81.5 /100 | #140 | Excellent 11.0% |
| Arabs | 81.5 /100 | #141 | Excellent 11.0% |
| Immigrants | Sudan | 81.5 /100 | #142 | Excellent 11.0% |
| Moroccans | 80.7 /100 | #143 | Excellent 11.0% |
Demographics Similar to Arapaho by Male Disability
In terms of male disability, the demographic groups most similar to Arapaho are French American Indian (13.4%, a difference of 0.15%), Spanish American (13.3%, a difference of 0.22%), French Canadian (13.3%, a difference of 0.42%), Blackfeet (13.4%, a difference of 0.58%), and Immigrants from the Azores (13.4%, a difference of 0.72%).
| Demographics | Rating | Rank | Male Disability |
| Cheyenne | 0.0 /100 | #300 | Tragic 13.0% |
| French | 0.0 /100 | #301 | Tragic 13.0% |
| Crow | 0.0 /100 | #302 | Tragic 13.1% |
| Scotch-Irish | 0.0 /100 | #303 | Tragic 13.2% |
| Blacks/African Americans | 0.0 /100 | #304 | Tragic 13.2% |
| French Canadians | 0.0 /100 | #305 | Tragic 13.3% |
| Spanish Americans | 0.0 /100 | #306 | Tragic 13.3% |
| Arapaho | 0.0 /100 | #307 | Tragic 13.3% |
| French American Indians | 0.0 /100 | #308 | Tragic 13.4% |
| Blackfeet | 0.0 /100 | #309 | Tragic 13.4% |
| Immigrants | Azores | 0.0 /100 | #310 | Tragic 13.4% |
| Delaware | 0.0 /100 | #311 | Tragic 13.5% |
| Yakama | 0.0 /100 | #312 | Tragic 13.5% |
| Puget Sound Salish | 0.0 /100 | #313 | Tragic 13.5% |
| Aleuts | 0.0 /100 | #314 | Tragic 13.5% |