Immigrants from Costa Rica vs Russian Male Disability
COMPARE
Immigrants from Costa Rica
Russian
Male Disability
Male Disability Comparison
Immigrants from Costa Rica
Russians
11.0%
MALE DISABILITY
82.8/ 100
METRIC RATING
136th/ 347
METRIC RANK
11.1%
MALE DISABILITY
69.8/ 100
METRIC RATING
156th/ 347
METRIC RANK
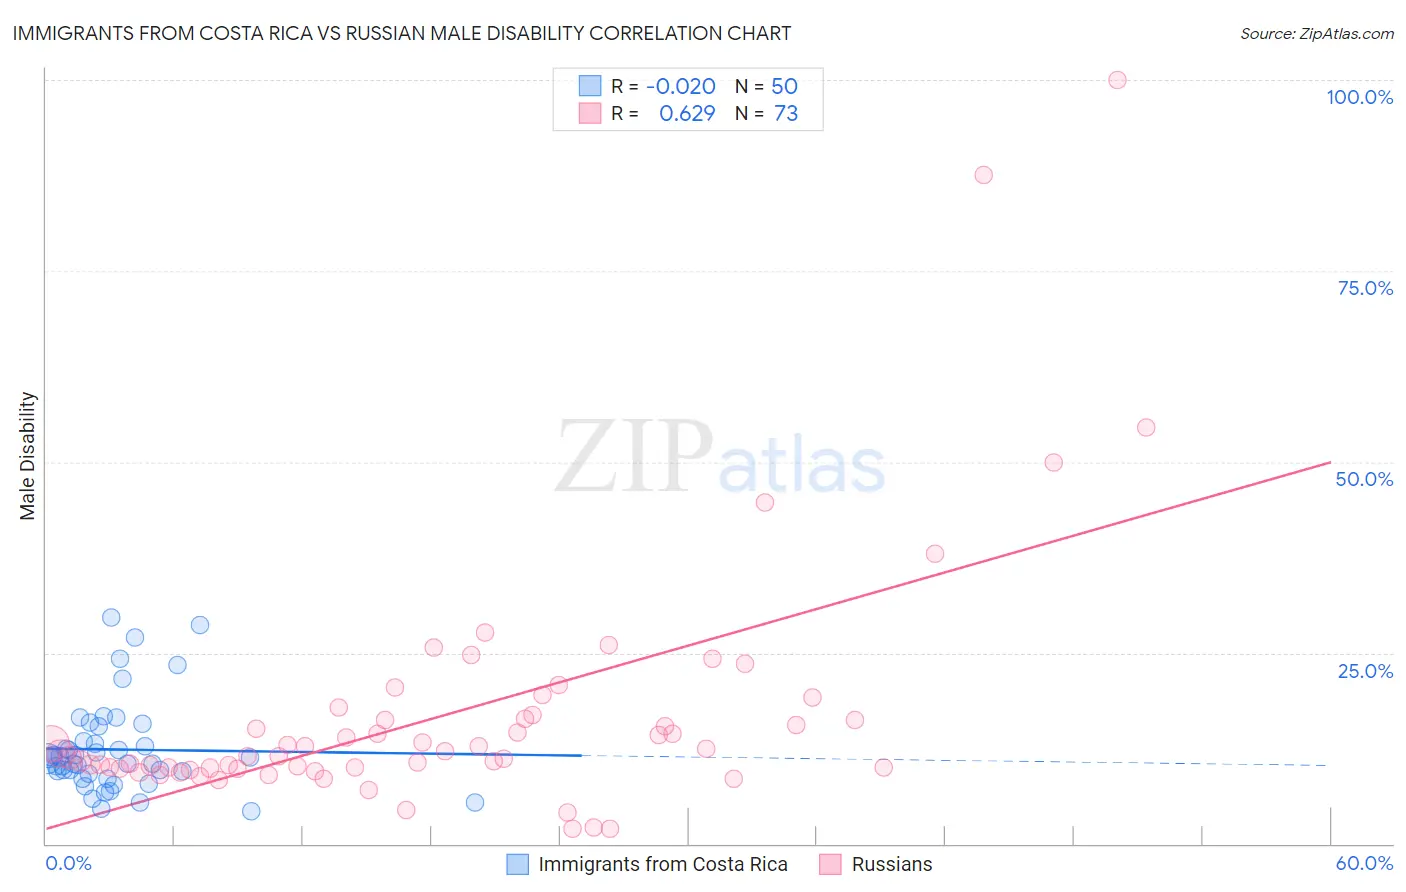
Immigrants from Costa Rica vs Russian Male Disability Correlation Chart
The statistical analysis conducted on geographies consisting of 204,275,290 people shows no correlation between the proportion of Immigrants from Costa Rica and percentage of males with a disability in the United States with a correlation coefficient (R) of -0.020 and weighted average of 11.0%. Similarly, the statistical analysis conducted on geographies consisting of 512,092,434 people shows a significant positive correlation between the proportion of Russians and percentage of males with a disability in the United States with a correlation coefficient (R) of 0.629 and weighted average of 11.1%, a difference of 1.0%.
Male Disability Correlation Summary
| Measurement | Immigrants from Costa Rica | Russian |
| Minimum | 4.3% | 2.0% |
| Maximum | 29.6% | 100.0% |
| Range | 25.3% | 98.0% |
| Mean | 12.4% | 16.8% |
| Median | 11.2% | 11.8% |
| Interquartile 25% (IQ1) | 9.2% | 9.9% |
| Interquartile 75% (IQ3) | 13.4% | 16.7% |
| Interquartile Range (IQR) | 4.2% | 6.8% |
| Standard Deviation (Sample) | 5.9% | 16.2% |
| Standard Deviation (Population) | 5.9% | 16.1% |
Demographics Similar to Immigrants from Costa Rica and Russians by Male Disability
In terms of male disability, the demographic groups most similar to Immigrants from Costa Rica are Immigrants from Europe (11.0%, a difference of 0.080%), Nigerian (11.0%, a difference of 0.090%), South African (11.0%, a difference of 0.11%), Immigrants from Italy (11.0%, a difference of 0.13%), and Arab (11.0%, a difference of 0.13%). Similarly, the demographic groups most similar to Russians are Immigrants from Middle Africa (11.1%, a difference of 0.070%), Immigrants from Moldova (11.1%, a difference of 0.21%), Immigrants from Northern Europe (11.1%, a difference of 0.23%), Immigrants from Albania (11.0%, a difference of 0.32%), and Cuban (11.0%, a difference of 0.35%).
| Demographics | Rating | Rank | Male Disability |
| Immigrants | Costa Rica | 82.8 /100 | #136 | Excellent 11.0% |
| Immigrants | Europe | 82.0 /100 | #137 | Excellent 11.0% |
| Nigerians | 81.9 /100 | #138 | Excellent 11.0% |
| South Africans | 81.7 /100 | #139 | Excellent 11.0% |
| Immigrants | Italy | 81.5 /100 | #140 | Excellent 11.0% |
| Arabs | 81.5 /100 | #141 | Excellent 11.0% |
| Immigrants | Sudan | 81.5 /100 | #142 | Excellent 11.0% |
| Moroccans | 80.7 /100 | #143 | Excellent 11.0% |
| Kenyans | 78.1 /100 | #144 | Good 11.0% |
| Costa Ricans | 78.0 /100 | #145 | Good 11.0% |
| Koreans | 77.5 /100 | #146 | Good 11.0% |
| Immigrants | Croatia | 77.3 /100 | #147 | Good 11.0% |
| Sudanese | 77.1 /100 | #148 | Good 11.0% |
| Immigrants | Denmark | 76.4 /100 | #149 | Good 11.0% |
| Immigrants | Guatemala | 75.1 /100 | #150 | Good 11.0% |
| Cubans | 74.9 /100 | #151 | Good 11.0% |
| Immigrants | Albania | 74.4 /100 | #152 | Good 11.0% |
| Immigrants | Northern Europe | 73.2 /100 | #153 | Good 11.1% |
| Immigrants | Moldova | 72.8 /100 | #154 | Good 11.1% |
| Immigrants | Middle Africa | 70.9 /100 | #155 | Good 11.1% |
| Russians | 69.8 /100 | #156 | Good 11.1% |