Immigrants from Costa Rica vs Czechoslovakian Male Disability
COMPARE
Immigrants from Costa Rica
Czechoslovakian
Male Disability
Male Disability Comparison
Immigrants from Costa Rica
Czechoslovakians
11.0%
MALE DISABILITY
82.8/ 100
METRIC RATING
136th/ 347
METRIC RANK
12.3%
MALE DISABILITY
0.1/ 100
METRIC RATING
269th/ 347
METRIC RANK
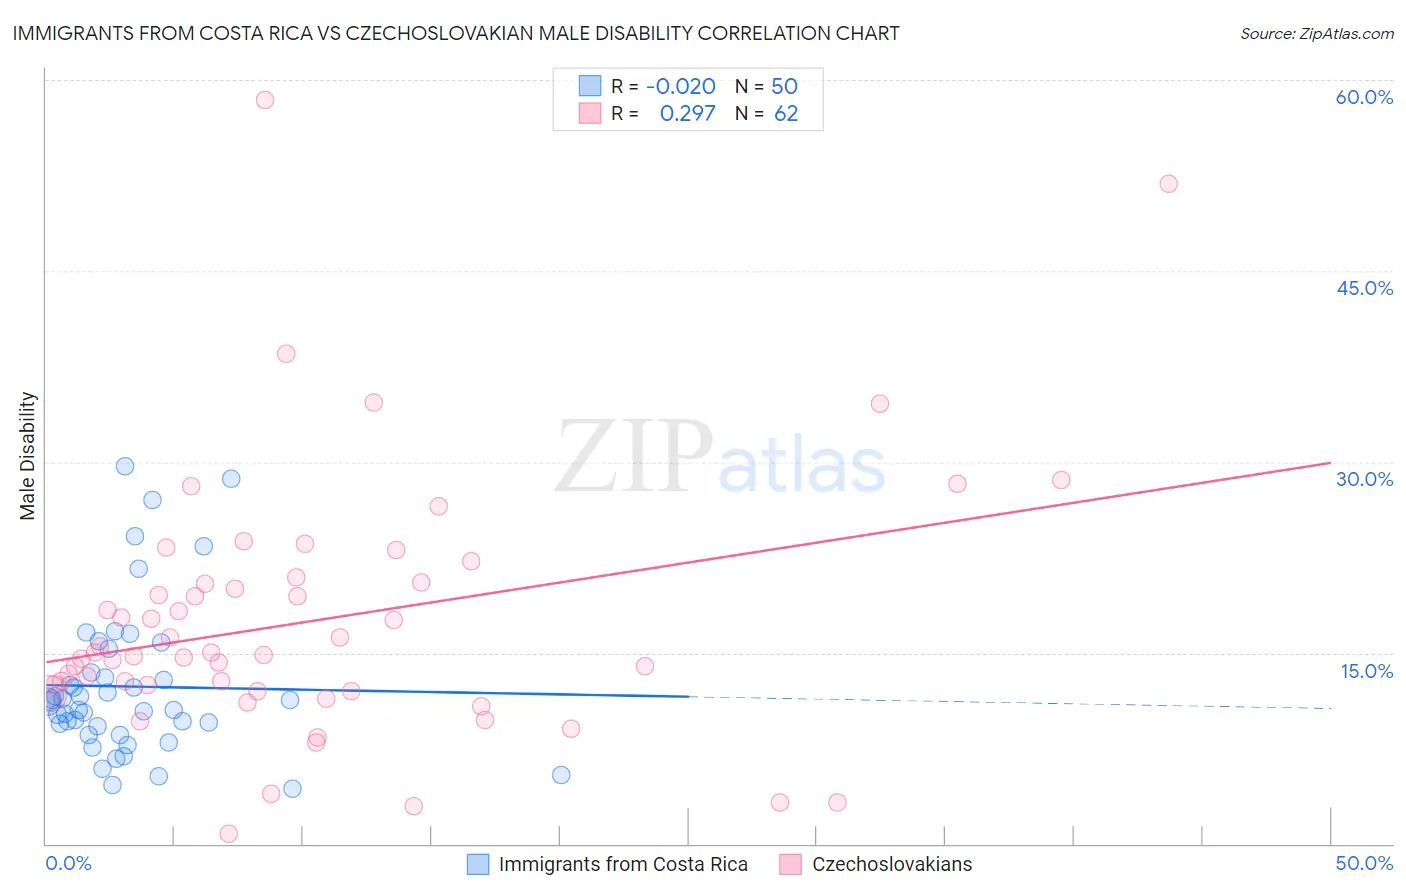
Immigrants from Costa Rica vs Czechoslovakian Male Disability Correlation Chart
The statistical analysis conducted on geographies consisting of 204,275,290 people shows no correlation between the proportion of Immigrants from Costa Rica and percentage of males with a disability in the United States with a correlation coefficient (R) of -0.020 and weighted average of 11.0%. Similarly, the statistical analysis conducted on geographies consisting of 368,653,122 people shows a weak positive correlation between the proportion of Czechoslovakians and percentage of males with a disability in the United States with a correlation coefficient (R) of 0.297 and weighted average of 12.3%, a difference of 12.0%.
Male Disability Correlation Summary
| Measurement | Immigrants from Costa Rica | Czechoslovakian |
| Minimum | 4.3% | 0.83% |
| Maximum | 29.6% | 58.5% |
| Range | 25.3% | 57.6% |
| Mean | 12.4% | 17.5% |
| Median | 11.2% | 14.9% |
| Interquartile 25% (IQ1) | 9.2% | 12.0% |
| Interquartile 75% (IQ3) | 13.4% | 20.6% |
| Interquartile Range (IQR) | 4.2% | 8.5% |
| Standard Deviation (Sample) | 5.9% | 10.3% |
| Standard Deviation (Population) | 5.9% | 10.2% |
Similar Demographics by Male Disability
Demographics Similar to Immigrants from Costa Rica by Male Disability
In terms of male disability, the demographic groups most similar to Immigrants from Costa Rica are Trinidadian and Tobagonian (11.0%, a difference of 0.040%), Bhutanese (11.0%, a difference of 0.060%), Immigrants from Europe (11.0%, a difference of 0.080%), Nigerian (11.0%, a difference of 0.090%), and Ugandan (11.0%, a difference of 0.11%).
| Demographics | Rating | Rank | Male Disability |
| Immigrants | Philippines | 85.4 /100 | #129 | Excellent 10.9% |
| Brazilians | 85.4 /100 | #130 | Excellent 10.9% |
| Macedonians | 84.2 /100 | #131 | Excellent 11.0% |
| Immigrants | Fiji | 84.0 /100 | #132 | Excellent 11.0% |
| Ugandans | 83.9 /100 | #133 | Excellent 11.0% |
| Bhutanese | 83.4 /100 | #134 | Excellent 11.0% |
| Trinidadians and Tobagonians | 83.3 /100 | #135 | Excellent 11.0% |
| Immigrants | Costa Rica | 82.8 /100 | #136 | Excellent 11.0% |
| Immigrants | Europe | 82.0 /100 | #137 | Excellent 11.0% |
| Nigerians | 81.9 /100 | #138 | Excellent 11.0% |
| South Africans | 81.7 /100 | #139 | Excellent 11.0% |
| Immigrants | Italy | 81.5 /100 | #140 | Excellent 11.0% |
| Arabs | 81.5 /100 | #141 | Excellent 11.0% |
| Immigrants | Sudan | 81.5 /100 | #142 | Excellent 11.0% |
| Moroccans | 80.7 /100 | #143 | Excellent 11.0% |
Demographics Similar to Czechoslovakians by Male Disability
In terms of male disability, the demographic groups most similar to Czechoslovakians are Portuguese (12.3%, a difference of 0.0%), Spaniard (12.3%, a difference of 0.080%), Immigrants from Germany (12.3%, a difference of 0.13%), Hawaiian (12.3%, a difference of 0.18%), and Immigrants from Portugal (12.3%, a difference of 0.19%).
| Demographics | Rating | Rank | Male Disability |
| Norwegians | 0.2 /100 | #262 | Tragic 12.2% |
| Canadians | 0.2 /100 | #263 | Tragic 12.2% |
| Nepalese | 0.2 /100 | #264 | Tragic 12.2% |
| Immigrants | Portugal | 0.1 /100 | #265 | Tragic 12.3% |
| Hawaiians | 0.1 /100 | #266 | Tragic 12.3% |
| Immigrants | Germany | 0.1 /100 | #267 | Tragic 12.3% |
| Portuguese | 0.1 /100 | #268 | Tragic 12.3% |
| Czechoslovakians | 0.1 /100 | #269 | Tragic 12.3% |
| Spaniards | 0.1 /100 | #270 | Tragic 12.3% |
| Scandinavians | 0.1 /100 | #271 | Tragic 12.3% |
| Hmong | 0.0 /100 | #272 | Tragic 12.5% |
| Native Hawaiians | 0.0 /100 | #273 | Tragic 12.5% |
| Hopi | 0.0 /100 | #274 | Tragic 12.5% |
| Fijians | 0.0 /100 | #275 | Tragic 12.6% |
| Africans | 0.0 /100 | #276 | Tragic 12.6% |