Immigrants from Portugal vs Dutch West Indian Male Disability
COMPARE
Immigrants from Portugal
Dutch West Indian
Male Disability
Male Disability Comparison
Immigrants from Portugal
Dutch West Indians
12.3%
MALE DISABILITY
0.1/ 100
METRIC RATING
265th/ 347
METRIC RANK
14.8%
MALE DISABILITY
0.0/ 100
METRIC RATING
335th/ 347
METRIC RANK
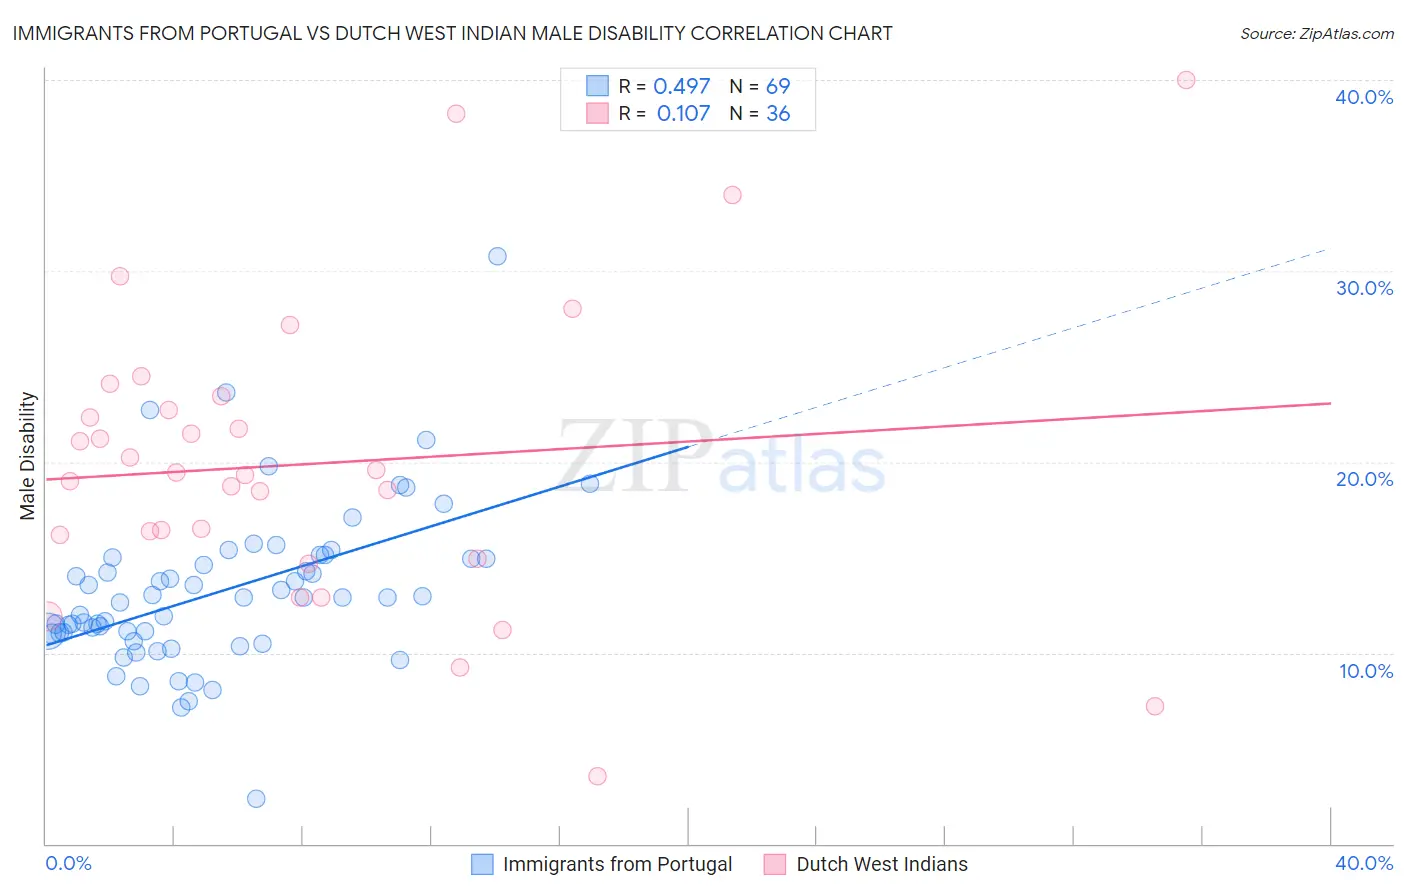
Immigrants from Portugal vs Dutch West Indian Male Disability Correlation Chart
The statistical analysis conducted on geographies consisting of 174,781,482 people shows a moderate positive correlation between the proportion of Immigrants from Portugal and percentage of males with a disability in the United States with a correlation coefficient (R) of 0.497 and weighted average of 12.3%. Similarly, the statistical analysis conducted on geographies consisting of 85,765,735 people shows a poor positive correlation between the proportion of Dutch West Indians and percentage of males with a disability in the United States with a correlation coefficient (R) of 0.107 and weighted average of 14.8%, a difference of 21.0%.
Male Disability Correlation Summary
| Measurement | Immigrants from Portugal | Dutch West Indian |
| Minimum | 2.4% | 3.5% |
| Maximum | 30.8% | 40.0% |
| Range | 28.4% | 36.5% |
| Mean | 13.2% | 19.9% |
| Median | 12.9% | 19.4% |
| Interquartile 25% (IQ1) | 11.0% | 15.5% |
| Interquartile 75% (IQ3) | 15.0% | 23.1% |
| Interquartile Range (IQR) | 3.9% | 7.5% |
| Standard Deviation (Sample) | 4.2% | 7.8% |
| Standard Deviation (Population) | 4.2% | 7.7% |
Similar Demographics by Male Disability
Demographics Similar to Immigrants from Portugal by Male Disability
In terms of male disability, the demographic groups most similar to Immigrants from Portugal are Hawaiian (12.3%, a difference of 0.020%), Immigrants from Germany (12.3%, a difference of 0.070%), Portuguese (12.3%, a difference of 0.19%), Czechoslovakian (12.3%, a difference of 0.19%), and Spaniard (12.3%, a difference of 0.28%).
| Demographics | Rating | Rank | Male Disability |
| Basques | 0.3 /100 | #258 | Tragic 12.1% |
| Belgians | 0.3 /100 | #259 | Tragic 12.1% |
| Swedes | 0.3 /100 | #260 | Tragic 12.1% |
| Slavs | 0.2 /100 | #261 | Tragic 12.2% |
| Norwegians | 0.2 /100 | #262 | Tragic 12.2% |
| Canadians | 0.2 /100 | #263 | Tragic 12.2% |
| Nepalese | 0.2 /100 | #264 | Tragic 12.2% |
| Immigrants | Portugal | 0.1 /100 | #265 | Tragic 12.3% |
| Hawaiians | 0.1 /100 | #266 | Tragic 12.3% |
| Immigrants | Germany | 0.1 /100 | #267 | Tragic 12.3% |
| Portuguese | 0.1 /100 | #268 | Tragic 12.3% |
| Czechoslovakians | 0.1 /100 | #269 | Tragic 12.3% |
| Spaniards | 0.1 /100 | #270 | Tragic 12.3% |
| Scandinavians | 0.1 /100 | #271 | Tragic 12.3% |
| Hmong | 0.0 /100 | #272 | Tragic 12.5% |
Demographics Similar to Dutch West Indians by Male Disability
In terms of male disability, the demographic groups most similar to Dutch West Indians are Cherokee (14.8%, a difference of 0.020%), Alaskan Athabascan (14.9%, a difference of 0.46%), Yuman (14.7%, a difference of 0.70%), Seminole (14.7%, a difference of 0.80%), and Menominee (15.0%, a difference of 0.97%).
| Demographics | Rating | Rank | Male Disability |
| Chippewa | 0.0 /100 | #328 | Tragic 14.3% |
| Cajuns | 0.0 /100 | #329 | Tragic 14.4% |
| Navajo | 0.0 /100 | #330 | Tragic 14.4% |
| Tohono O'odham | 0.0 /100 | #331 | Tragic 14.6% |
| Seminole | 0.0 /100 | #332 | Tragic 14.7% |
| Yuman | 0.0 /100 | #333 | Tragic 14.7% |
| Cherokee | 0.0 /100 | #334 | Tragic 14.8% |
| Dutch West Indians | 0.0 /100 | #335 | Tragic 14.8% |
| Alaskan Athabascans | 0.0 /100 | #336 | Tragic 14.9% |
| Menominee | 0.0 /100 | #337 | Tragic 15.0% |
| Pueblo | 0.0 /100 | #338 | Tragic 15.0% |
| Chickasaw | 0.0 /100 | #339 | Tragic 15.1% |
| Lumbee | 0.0 /100 | #340 | Tragic 15.2% |
| Choctaw | 0.0 /100 | #341 | Tragic 15.4% |
| Kiowa | 0.0 /100 | #342 | Tragic 15.4% |