Yup'ik vs Immigrants from Liberia Disability
COMPARE
Yup'ik
Immigrants from Liberia
Disability
Disability Comparison
Yup'ik
Immigrants from Liberia
12.2%
DISABILITY
2.2/ 100
METRIC RATING
235th/ 347
METRIC RANK
12.4%
DISABILITY
0.4/ 100
METRIC RATING
260th/ 347
METRIC RANK
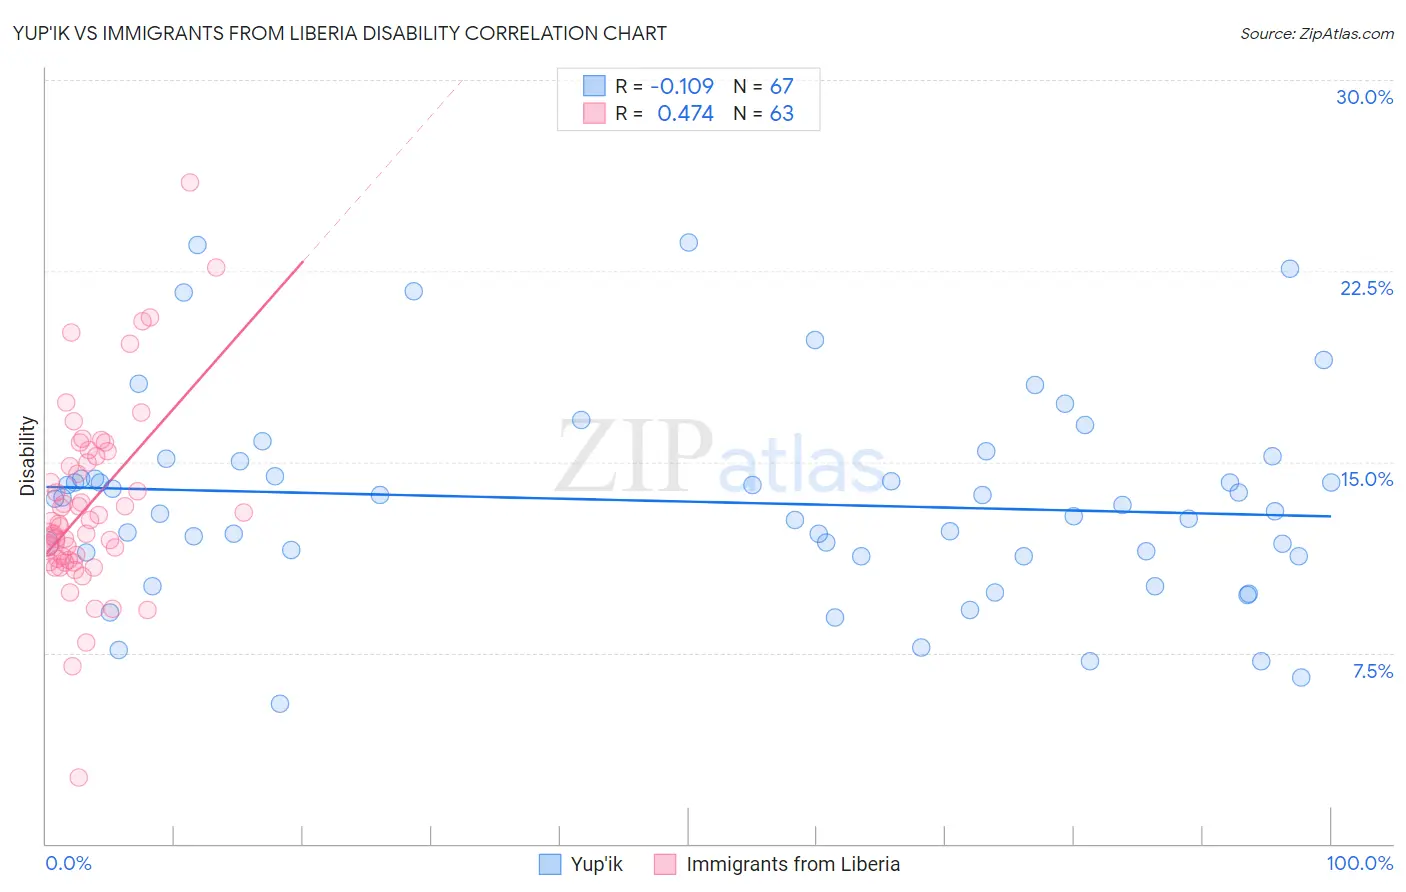
Yup'ik vs Immigrants from Liberia Disability Correlation Chart
The statistical analysis conducted on geographies consisting of 39,961,482 people shows a poor negative correlation between the proportion of Yup'ik and percentage of population with a disability in the United States with a correlation coefficient (R) of -0.109 and weighted average of 12.2%. Similarly, the statistical analysis conducted on geographies consisting of 135,259,590 people shows a moderate positive correlation between the proportion of Immigrants from Liberia and percentage of population with a disability in the United States with a correlation coefficient (R) of 0.474 and weighted average of 12.4%, a difference of 1.8%.
Disability Correlation Summary
| Measurement | Yup'ik | Immigrants from Liberia |
| Minimum | 5.5% | 2.6% |
| Maximum | 23.6% | 26.0% |
| Range | 18.1% | 23.4% |
| Mean | 13.4% | 13.3% |
| Median | 13.3% | 12.5% |
| Interquartile 25% (IQ1) | 11.3% | 11.2% |
| Interquartile 75% (IQ3) | 15.0% | 15.2% |
| Interquartile Range (IQR) | 3.7% | 4.1% |
| Standard Deviation (Sample) | 3.9% | 3.7% |
| Standard Deviation (Population) | 3.9% | 3.7% |
Similar Demographics by Disability
Demographics Similar to Yup'ik by Disability
In terms of disability, the demographic groups most similar to Yup'ik are Japanese (12.2%, a difference of 0.040%), Bahamian (12.2%, a difference of 0.070%), Chinese (12.2%, a difference of 0.090%), Immigrants from Congo (12.2%, a difference of 0.14%), and Italian (12.2%, a difference of 0.16%).
| Demographics | Rating | Rank | Disability |
| West Indians | 2.9 /100 | #228 | Tragic 12.2% |
| Inupiat | 2.8 /100 | #229 | Tragic 12.2% |
| Samoans | 2.6 /100 | #230 | Tragic 12.2% |
| Malaysians | 2.5 /100 | #231 | Tragic 12.2% |
| Italians | 2.5 /100 | #232 | Tragic 12.2% |
| Bahamians | 2.3 /100 | #233 | Tragic 12.2% |
| Japanese | 2.3 /100 | #234 | Tragic 12.2% |
| Yup'ik | 2.2 /100 | #235 | Tragic 12.2% |
| Chinese | 2.0 /100 | #236 | Tragic 12.2% |
| Immigrants | Congo | 1.9 /100 | #237 | Tragic 12.2% |
| Norwegians | 1.9 /100 | #238 | Tragic 12.2% |
| Swedes | 1.8 /100 | #239 | Tragic 12.2% |
| Hungarians | 1.7 /100 | #240 | Tragic 12.2% |
| Yugoslavians | 1.7 /100 | #241 | Tragic 12.2% |
| Poles | 1.7 /100 | #242 | Tragic 12.2% |
Demographics Similar to Immigrants from Liberia by Disability
In terms of disability, the demographic groups most similar to Immigrants from Liberia are Canadian (12.4%, a difference of 0.030%), Scandinavian (12.4%, a difference of 0.070%), Slavic (12.4%, a difference of 0.090%), Immigrants from Laos (12.4%, a difference of 0.23%), and Immigrants from Dominica (12.4%, a difference of 0.32%).
| Demographics | Rating | Rank | Disability |
| Belgians | 0.8 /100 | #253 | Tragic 12.3% |
| German Russians | 0.8 /100 | #254 | Tragic 12.3% |
| Slovenes | 0.6 /100 | #255 | Tragic 12.4% |
| Immigrants | Dominica | 0.6 /100 | #256 | Tragic 12.4% |
| Immigrants | Laos | 0.5 /100 | #257 | Tragic 12.4% |
| Slavs | 0.5 /100 | #258 | Tragic 12.4% |
| Canadians | 0.4 /100 | #259 | Tragic 12.4% |
| Immigrants | Liberia | 0.4 /100 | #260 | Tragic 12.4% |
| Scandinavians | 0.4 /100 | #261 | Tragic 12.4% |
| Native Hawaiians | 0.3 /100 | #262 | Tragic 12.5% |
| Hawaiians | 0.2 /100 | #263 | Tragic 12.5% |
| Immigrants | Germany | 0.2 /100 | #264 | Tragic 12.5% |
| U.S. Virgin Islanders | 0.2 /100 | #265 | Tragic 12.5% |
| Czechoslovakians | 0.2 /100 | #266 | Tragic 12.5% |
| Spaniards | 0.2 /100 | #267 | Tragic 12.5% |