Immigrants from Central America vs Immigrants from Eastern Europe Self-Care Disability
COMPARE
Immigrants from Central America
Immigrants from Eastern Europe
Self-Care Disability
Self-Care Disability Comparison
Immigrants from Central America
Immigrants from Eastern Europe
2.6%
SELF-CARE DISABILITY
0.3/ 100
METRIC RATING
256th/ 347
METRIC RANK
2.5%
SELF-CARE DISABILITY
28.0/ 100
METRIC RATING
189th/ 347
METRIC RANK
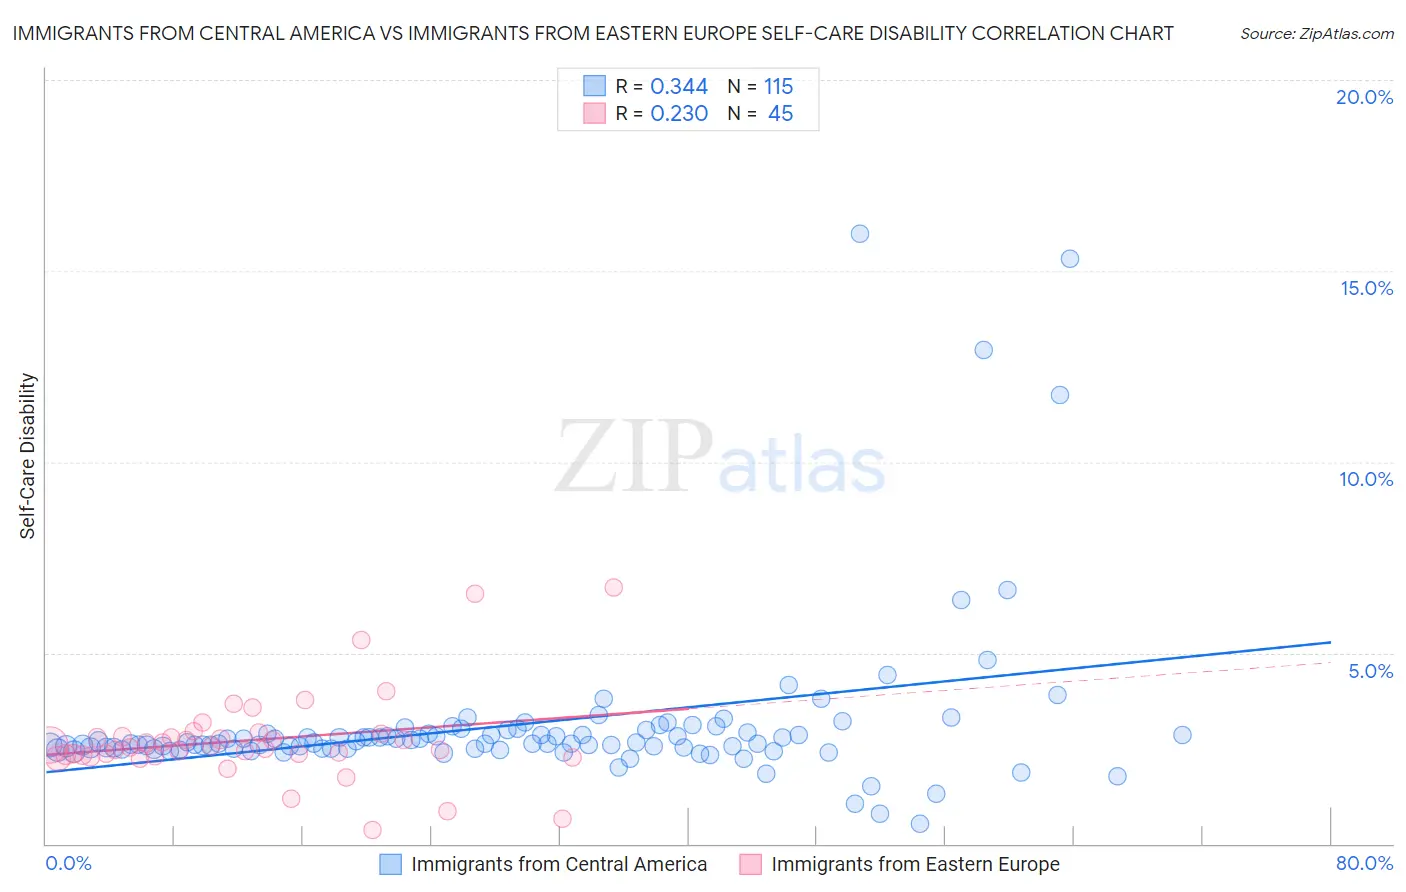
Immigrants from Central America vs Immigrants from Eastern Europe Self-Care Disability Correlation Chart
The statistical analysis conducted on geographies consisting of 534,996,310 people shows a mild positive correlation between the proportion of Immigrants from Central America and percentage of population with self-care disability in the United States with a correlation coefficient (R) of 0.344 and weighted average of 2.6%. Similarly, the statistical analysis conducted on geographies consisting of 474,965,919 people shows a weak positive correlation between the proportion of Immigrants from Eastern Europe and percentage of population with self-care disability in the United States with a correlation coefficient (R) of 0.230 and weighted average of 2.5%, a difference of 5.6%.
Self-Care Disability Correlation Summary
| Measurement | Immigrants from Central America | Immigrants from Eastern Europe |
| Minimum | 0.52% | 0.35% |
| Maximum | 16.0% | 6.7% |
| Range | 15.5% | 6.4% |
| Mean | 3.1% | 2.7% |
| Median | 2.6% | 2.5% |
| Interquartile 25% (IQ1) | 2.5% | 2.3% |
| Interquartile 75% (IQ3) | 2.9% | 2.8% |
| Interquartile Range (IQR) | 0.43% | 0.54% |
| Standard Deviation (Sample) | 2.2% | 1.2% |
| Standard Deviation (Population) | 2.2% | 1.2% |
Similar Demographics by Self-Care Disability
Demographics Similar to Immigrants from Central America by Self-Care Disability
In terms of self-care disability, the demographic groups most similar to Immigrants from Central America are Tsimshian (2.6%, a difference of 0.020%), Haitian (2.6%, a difference of 0.060%), Immigrants from Haiti (2.6%, a difference of 0.080%), Immigrants from Bangladesh (2.6%, a difference of 0.16%), and Potawatomi (2.6%, a difference of 0.20%).
| Demographics | Rating | Rank | Self-Care Disability |
| Mexican American Indians | 0.5 /100 | #249 | Tragic 2.6% |
| Portuguese | 0.4 /100 | #250 | Tragic 2.6% |
| Immigrants | Liberia | 0.4 /100 | #251 | Tragic 2.6% |
| Immigrants | Bangladesh | 0.4 /100 | #252 | Tragic 2.6% |
| Immigrants | Haiti | 0.3 /100 | #253 | Tragic 2.6% |
| Haitians | 0.3 /100 | #254 | Tragic 2.6% |
| Tsimshian | 0.3 /100 | #255 | Tragic 2.6% |
| Immigrants | Central America | 0.3 /100 | #256 | Tragic 2.6% |
| Potawatomi | 0.3 /100 | #257 | Tragic 2.6% |
| Immigrants | Nonimmigrants | 0.3 /100 | #258 | Tragic 2.6% |
| Immigrants | Belarus | 0.2 /100 | #259 | Tragic 2.6% |
| Chippewa | 0.2 /100 | #260 | Tragic 2.6% |
| Arapaho | 0.2 /100 | #261 | Tragic 2.6% |
| Shoshone | 0.2 /100 | #262 | Tragic 2.7% |
| Immigrants | Latin America | 0.2 /100 | #263 | Tragic 2.7% |
Demographics Similar to Immigrants from Eastern Europe by Self-Care Disability
In terms of self-care disability, the demographic groups most similar to Immigrants from Eastern Europe are Immigrants from Oceania (2.5%, a difference of 0.010%), Irish (2.5%, a difference of 0.040%), Sioux (2.5%, a difference of 0.21%), Immigrants from El Salvador (2.5%, a difference of 0.28%), and Moroccan (2.5%, a difference of 0.32%).
| Demographics | Rating | Rank | Self-Care Disability |
| Maltese | 37.5 /100 | #182 | Fair 2.5% |
| Salvadorans | 36.4 /100 | #183 | Fair 2.5% |
| Yugoslavians | 36.1 /100 | #184 | Fair 2.5% |
| Slavs | 34.3 /100 | #185 | Fair 2.5% |
| Immigrants | El Salvador | 33.0 /100 | #186 | Fair 2.5% |
| Irish | 28.7 /100 | #187 | Fair 2.5% |
| Immigrants | Oceania | 28.3 /100 | #188 | Fair 2.5% |
| Immigrants | Eastern Europe | 28.0 /100 | #189 | Fair 2.5% |
| Sioux | 24.6 /100 | #190 | Fair 2.5% |
| Moroccans | 22.9 /100 | #191 | Fair 2.5% |
| Soviet Union | 22.2 /100 | #192 | Fair 2.5% |
| Ukrainians | 21.4 /100 | #193 | Fair 2.5% |
| Immigrants | Germany | 17.9 /100 | #194 | Poor 2.5% |
| Immigrants | Southern Europe | 15.6 /100 | #195 | Poor 2.5% |
| Koreans | 15.5 /100 | #196 | Poor 2.5% |