Israeli vs Immigrants from Eastern Europe Self-Care Disability
COMPARE
Israeli
Immigrants from Eastern Europe
Self-Care Disability
Self-Care Disability Comparison
Israelis
Immigrants from Eastern Europe
2.4%
SELF-CARE DISABILITY
80.0/ 100
METRIC RATING
146th/ 347
METRIC RANK
2.5%
SELF-CARE DISABILITY
28.0/ 100
METRIC RATING
189th/ 347
METRIC RANK
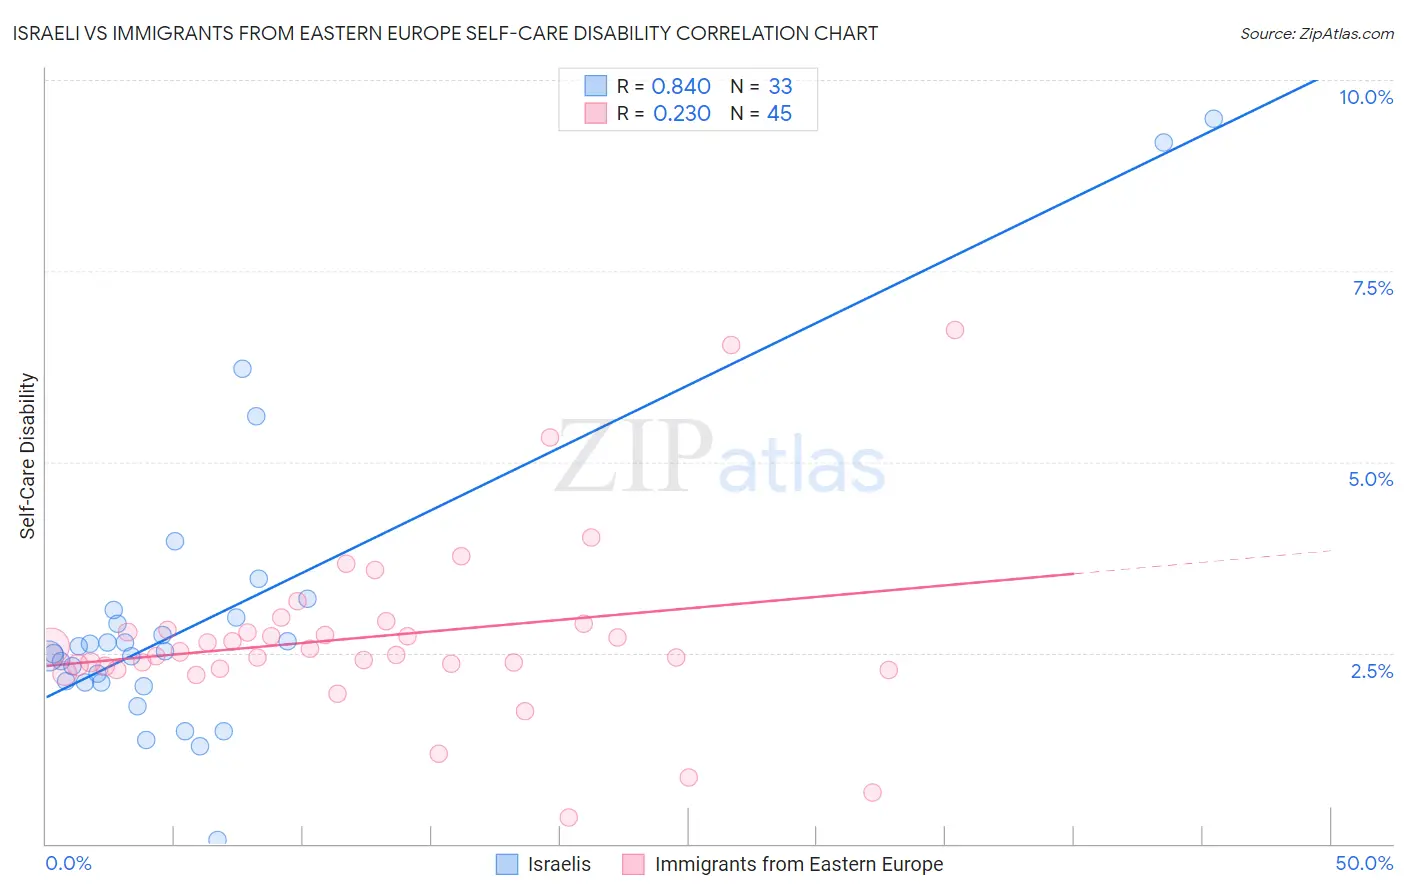
Israeli vs Immigrants from Eastern Europe Self-Care Disability Correlation Chart
The statistical analysis conducted on geographies consisting of 210,973,886 people shows a very strong positive correlation between the proportion of Israelis and percentage of population with self-care disability in the United States with a correlation coefficient (R) of 0.840 and weighted average of 2.4%. Similarly, the statistical analysis conducted on geographies consisting of 474,965,919 people shows a weak positive correlation between the proportion of Immigrants from Eastern Europe and percentage of population with self-care disability in the United States with a correlation coefficient (R) of 0.230 and weighted average of 2.5%, a difference of 2.8%.
Self-Care Disability Correlation Summary
| Measurement | Israeli | Immigrants from Eastern Europe |
| Minimum | 0.046% | 0.35% |
| Maximum | 9.5% | 6.7% |
| Range | 9.4% | 6.4% |
| Mean | 3.0% | 2.7% |
| Median | 2.5% | 2.5% |
| Interquartile 25% (IQ1) | 2.1% | 2.3% |
| Interquartile 75% (IQ3) | 3.0% | 2.8% |
| Interquartile Range (IQR) | 0.90% | 0.54% |
| Standard Deviation (Sample) | 2.0% | 1.2% |
| Standard Deviation (Population) | 2.0% | 1.2% |
Similar Demographics by Self-Care Disability
Demographics Similar to Israelis by Self-Care Disability
In terms of self-care disability, the demographic groups most similar to Israelis are German (2.4%, a difference of 0.010%), Costa Rican (2.4%, a difference of 0.060%), Afghan (2.4%, a difference of 0.18%), Dutch (2.4%, a difference of 0.18%), and Immigrants from Peru (2.4%, a difference of 0.26%).
| Demographics | Rating | Rank | Self-Care Disability |
| Sri Lankans | 86.6 /100 | #139 | Excellent 2.4% |
| Immigrants | Uruguay | 85.4 /100 | #140 | Excellent 2.4% |
| Alaska Natives | 84.5 /100 | #141 | Excellent 2.4% |
| Immigrants | Peru | 83.2 /100 | #142 | Excellent 2.4% |
| Afghans | 82.3 /100 | #143 | Excellent 2.4% |
| Costa Ricans | 80.8 /100 | #144 | Excellent 2.4% |
| Germans | 80.1 /100 | #145 | Excellent 2.4% |
| Israelis | 80.0 /100 | #146 | Good 2.4% |
| Dutch | 77.5 /100 | #147 | Good 2.4% |
| Romanians | 75.8 /100 | #148 | Good 2.4% |
| Arabs | 75.7 /100 | #149 | Good 2.4% |
| Immigrants | Costa Rica | 75.1 /100 | #150 | Good 2.4% |
| Basques | 74.0 /100 | #151 | Good 2.4% |
| Tlingit-Haida | 73.5 /100 | #152 | Good 2.4% |
| Immigrants | England | 73.5 /100 | #153 | Good 2.4% |
Demographics Similar to Immigrants from Eastern Europe by Self-Care Disability
In terms of self-care disability, the demographic groups most similar to Immigrants from Eastern Europe are Immigrants from Oceania (2.5%, a difference of 0.010%), Irish (2.5%, a difference of 0.040%), Sioux (2.5%, a difference of 0.21%), Immigrants from El Salvador (2.5%, a difference of 0.28%), and Moroccan (2.5%, a difference of 0.32%).
| Demographics | Rating | Rank | Self-Care Disability |
| Maltese | 37.5 /100 | #182 | Fair 2.5% |
| Salvadorans | 36.4 /100 | #183 | Fair 2.5% |
| Yugoslavians | 36.1 /100 | #184 | Fair 2.5% |
| Slavs | 34.3 /100 | #185 | Fair 2.5% |
| Immigrants | El Salvador | 33.0 /100 | #186 | Fair 2.5% |
| Irish | 28.7 /100 | #187 | Fair 2.5% |
| Immigrants | Oceania | 28.3 /100 | #188 | Fair 2.5% |
| Immigrants | Eastern Europe | 28.0 /100 | #189 | Fair 2.5% |
| Sioux | 24.6 /100 | #190 | Fair 2.5% |
| Moroccans | 22.9 /100 | #191 | Fair 2.5% |
| Soviet Union | 22.2 /100 | #192 | Fair 2.5% |
| Ukrainians | 21.4 /100 | #193 | Fair 2.5% |
| Immigrants | Germany | 17.9 /100 | #194 | Poor 2.5% |
| Immigrants | Southern Europe | 15.6 /100 | #195 | Poor 2.5% |
| Koreans | 15.5 /100 | #196 | Poor 2.5% |