Immigrants from Syria vs Immigrants from Eastern Europe Self-Care Disability
COMPARE
Immigrants from Syria
Immigrants from Eastern Europe
Self-Care Disability
Self-Care Disability Comparison
Immigrants from Syria
Immigrants from Eastern Europe
2.6%
SELF-CARE DISABILITY
1.0/ 100
METRIC RATING
241st/ 347
METRIC RANK
2.5%
SELF-CARE DISABILITY
28.0/ 100
METRIC RATING
189th/ 347
METRIC RANK
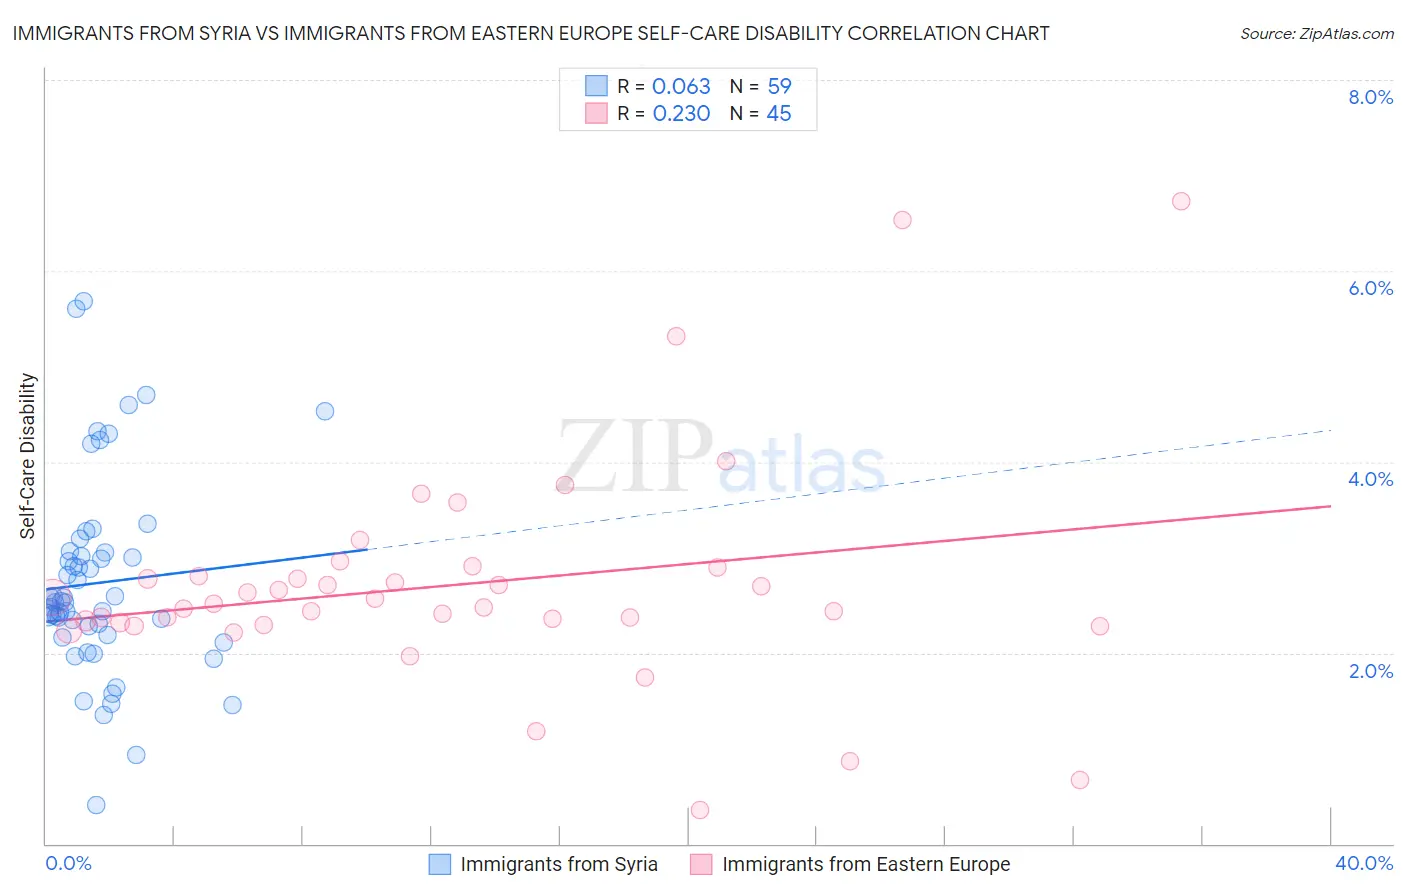
Immigrants from Syria vs Immigrants from Eastern Europe Self-Care Disability Correlation Chart
The statistical analysis conducted on geographies consisting of 174,100,032 people shows a slight positive correlation between the proportion of Immigrants from Syria and percentage of population with self-care disability in the United States with a correlation coefficient (R) of 0.063 and weighted average of 2.6%. Similarly, the statistical analysis conducted on geographies consisting of 474,965,919 people shows a weak positive correlation between the proportion of Immigrants from Eastern Europe and percentage of population with self-care disability in the United States with a correlation coefficient (R) of 0.230 and weighted average of 2.5%, a difference of 4.3%.
Self-Care Disability Correlation Summary
| Measurement | Immigrants from Syria | Immigrants from Eastern Europe |
| Minimum | 0.40% | 0.35% |
| Maximum | 5.7% | 6.7% |
| Range | 5.3% | 6.4% |
| Mean | 2.7% | 2.7% |
| Median | 2.5% | 2.5% |
| Interquartile 25% (IQ1) | 2.2% | 2.3% |
| Interquartile 75% (IQ3) | 3.1% | 2.8% |
| Interquartile Range (IQR) | 0.86% | 0.54% |
| Standard Deviation (Sample) | 1.0% | 1.2% |
| Standard Deviation (Population) | 1.0% | 1.2% |
Similar Demographics by Self-Care Disability
Demographics Similar to Immigrants from Syria by Self-Care Disability
In terms of self-care disability, the demographic groups most similar to Immigrants from Syria are Marshallese (2.6%, a difference of 0.17%), Immigrants from Panama (2.6%, a difference of 0.20%), Spanish (2.6%, a difference of 0.23%), Senegalese (2.6%, a difference of 0.24%), and Hawaiian (2.6%, a difference of 0.31%).
| Demographics | Rating | Rank | Self-Care Disability |
| Vietnamese | 2.1 /100 | #234 | Tragic 2.6% |
| Bahamians | 2.0 /100 | #235 | Tragic 2.6% |
| Bermudans | 1.9 /100 | #236 | Tragic 2.6% |
| Immigrants | Senegal | 1.6 /100 | #237 | Tragic 2.6% |
| Senegalese | 1.3 /100 | #238 | Tragic 2.6% |
| Immigrants | Panama | 1.2 /100 | #239 | Tragic 2.6% |
| Marshallese | 1.2 /100 | #240 | Tragic 2.6% |
| Immigrants | Syria | 1.0 /100 | #241 | Tragic 2.6% |
| Spanish | 0.8 /100 | #242 | Tragic 2.6% |
| Hawaiians | 0.8 /100 | #243 | Tragic 2.6% |
| Yuman | 0.8 /100 | #244 | Tragic 2.6% |
| Immigrants | Western Asia | 0.6 /100 | #245 | Tragic 2.6% |
| Cheyenne | 0.6 /100 | #246 | Tragic 2.6% |
| Immigrants | Albania | 0.6 /100 | #247 | Tragic 2.6% |
| Nicaraguans | 0.6 /100 | #248 | Tragic 2.6% |
Demographics Similar to Immigrants from Eastern Europe by Self-Care Disability
In terms of self-care disability, the demographic groups most similar to Immigrants from Eastern Europe are Immigrants from Oceania (2.5%, a difference of 0.010%), Irish (2.5%, a difference of 0.040%), Sioux (2.5%, a difference of 0.21%), Immigrants from El Salvador (2.5%, a difference of 0.28%), and Moroccan (2.5%, a difference of 0.32%).
| Demographics | Rating | Rank | Self-Care Disability |
| Maltese | 37.5 /100 | #182 | Fair 2.5% |
| Salvadorans | 36.4 /100 | #183 | Fair 2.5% |
| Yugoslavians | 36.1 /100 | #184 | Fair 2.5% |
| Slavs | 34.3 /100 | #185 | Fair 2.5% |
| Immigrants | El Salvador | 33.0 /100 | #186 | Fair 2.5% |
| Irish | 28.7 /100 | #187 | Fair 2.5% |
| Immigrants | Oceania | 28.3 /100 | #188 | Fair 2.5% |
| Immigrants | Eastern Europe | 28.0 /100 | #189 | Fair 2.5% |
| Sioux | 24.6 /100 | #190 | Fair 2.5% |
| Moroccans | 22.9 /100 | #191 | Fair 2.5% |
| Soviet Union | 22.2 /100 | #192 | Fair 2.5% |
| Ukrainians | 21.4 /100 | #193 | Fair 2.5% |
| Immigrants | Germany | 17.9 /100 | #194 | Poor 2.5% |
| Immigrants | Southern Europe | 15.6 /100 | #195 | Poor 2.5% |
| Koreans | 15.5 /100 | #196 | Poor 2.5% |