Immigrants from Central America vs Afghan Self-Care Disability
COMPARE
Immigrants from Central America
Afghan
Self-Care Disability
Self-Care Disability Comparison
Immigrants from Central America
Afghans
2.6%
SELF-CARE DISABILITY
0.3/ 100
METRIC RATING
256th/ 347
METRIC RANK
2.4%
SELF-CARE DISABILITY
82.3/ 100
METRIC RATING
143rd/ 347
METRIC RANK
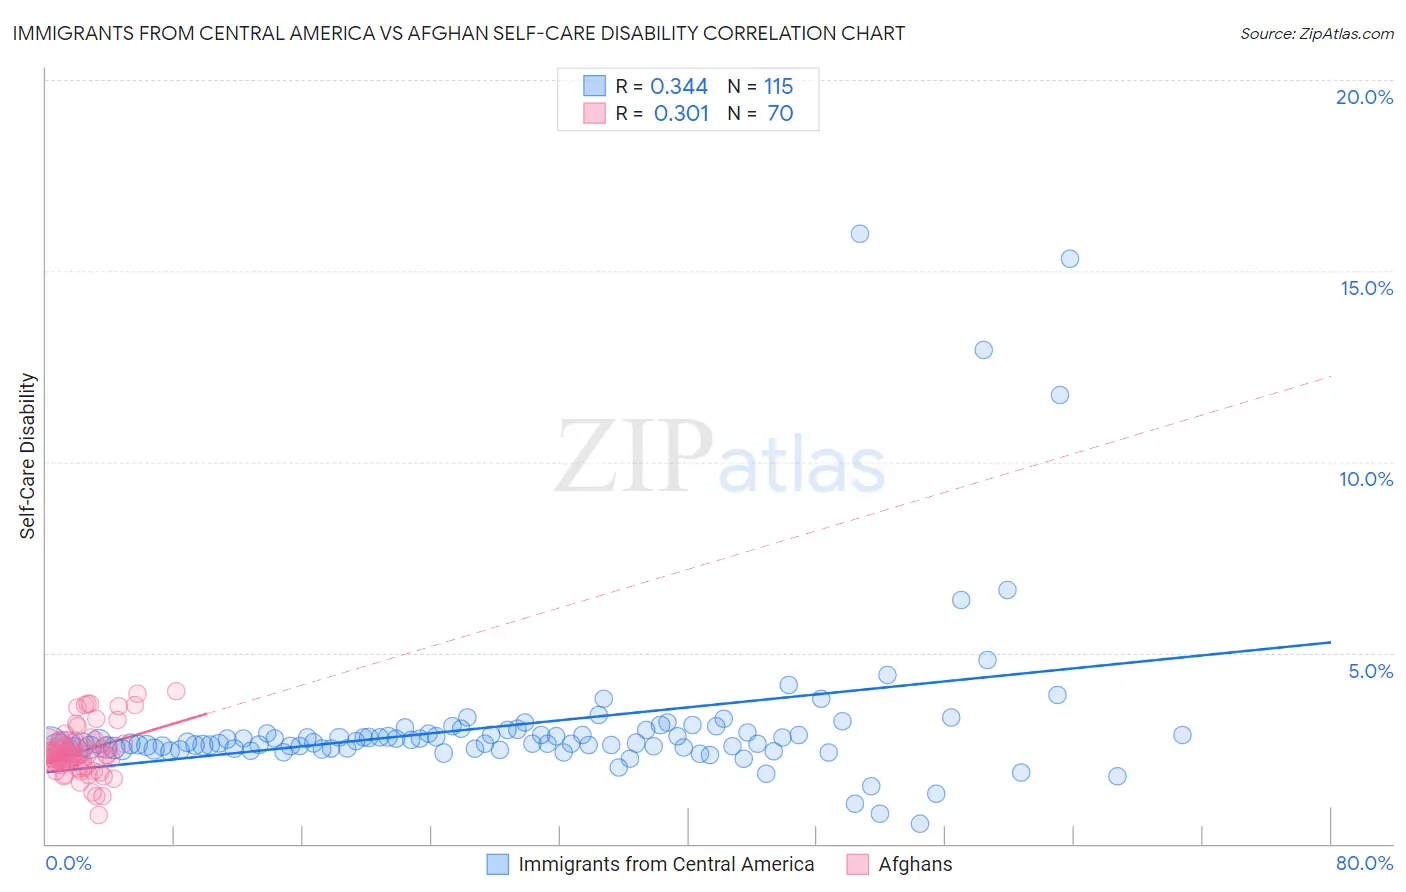
Immigrants from Central America vs Afghan Self-Care Disability Correlation Chart
The statistical analysis conducted on geographies consisting of 534,996,310 people shows a mild positive correlation between the proportion of Immigrants from Central America and percentage of population with self-care disability in the United States with a correlation coefficient (R) of 0.344 and weighted average of 2.6%. Similarly, the statistical analysis conducted on geographies consisting of 148,790,776 people shows a mild positive correlation between the proportion of Afghans and percentage of population with self-care disability in the United States with a correlation coefficient (R) of 0.301 and weighted average of 2.4%, a difference of 8.8%.
Self-Care Disability Correlation Summary
| Measurement | Immigrants from Central America | Afghan |
| Minimum | 0.52% | 0.74% |
| Maximum | 16.0% | 4.0% |
| Range | 15.5% | 3.3% |
| Mean | 3.1% | 2.4% |
| Median | 2.6% | 2.3% |
| Interquartile 25% (IQ1) | 2.5% | 2.1% |
| Interquartile 75% (IQ3) | 2.9% | 2.7% |
| Interquartile Range (IQR) | 0.43% | 0.59% |
| Standard Deviation (Sample) | 2.2% | 0.65% |
| Standard Deviation (Population) | 2.2% | 0.64% |
Similar Demographics by Self-Care Disability
Demographics Similar to Immigrants from Central America by Self-Care Disability
In terms of self-care disability, the demographic groups most similar to Immigrants from Central America are Tsimshian (2.6%, a difference of 0.020%), Haitian (2.6%, a difference of 0.060%), Immigrants from Haiti (2.6%, a difference of 0.080%), Immigrants from Bangladesh (2.6%, a difference of 0.16%), and Potawatomi (2.6%, a difference of 0.20%).
| Demographics | Rating | Rank | Self-Care Disability |
| Mexican American Indians | 0.5 /100 | #249 | Tragic 2.6% |
| Portuguese | 0.4 /100 | #250 | Tragic 2.6% |
| Immigrants | Liberia | 0.4 /100 | #251 | Tragic 2.6% |
| Immigrants | Bangladesh | 0.4 /100 | #252 | Tragic 2.6% |
| Immigrants | Haiti | 0.3 /100 | #253 | Tragic 2.6% |
| Haitians | 0.3 /100 | #254 | Tragic 2.6% |
| Tsimshian | 0.3 /100 | #255 | Tragic 2.6% |
| Immigrants | Central America | 0.3 /100 | #256 | Tragic 2.6% |
| Potawatomi | 0.3 /100 | #257 | Tragic 2.6% |
| Immigrants | Nonimmigrants | 0.3 /100 | #258 | Tragic 2.6% |
| Immigrants | Belarus | 0.2 /100 | #259 | Tragic 2.6% |
| Chippewa | 0.2 /100 | #260 | Tragic 2.6% |
| Arapaho | 0.2 /100 | #261 | Tragic 2.6% |
| Shoshone | 0.2 /100 | #262 | Tragic 2.7% |
| Immigrants | Latin America | 0.2 /100 | #263 | Tragic 2.7% |
Demographics Similar to Afghans by Self-Care Disability
In terms of self-care disability, the demographic groups most similar to Afghans are Immigrants from Peru (2.4%, a difference of 0.080%), Costa Rican (2.4%, a difference of 0.12%), German (2.4%, a difference of 0.17%), Israeli (2.4%, a difference of 0.18%), and Alaska Native (2.4%, a difference of 0.19%).
| Demographics | Rating | Rank | Self-Care Disability |
| South American Indians | 87.2 /100 | #136 | Excellent 2.4% |
| Austrians | 87.0 /100 | #137 | Excellent 2.4% |
| Immigrants | Croatia | 86.6 /100 | #138 | Excellent 2.4% |
| Sri Lankans | 86.6 /100 | #139 | Excellent 2.4% |
| Immigrants | Uruguay | 85.4 /100 | #140 | Excellent 2.4% |
| Alaska Natives | 84.5 /100 | #141 | Excellent 2.4% |
| Immigrants | Peru | 83.2 /100 | #142 | Excellent 2.4% |
| Afghans | 82.3 /100 | #143 | Excellent 2.4% |
| Costa Ricans | 80.8 /100 | #144 | Excellent 2.4% |
| Germans | 80.1 /100 | #145 | Excellent 2.4% |
| Israelis | 80.0 /100 | #146 | Good 2.4% |
| Dutch | 77.5 /100 | #147 | Good 2.4% |
| Romanians | 75.8 /100 | #148 | Good 2.4% |
| Arabs | 75.7 /100 | #149 | Good 2.4% |
| Immigrants | Costa Rica | 75.1 /100 | #150 | Good 2.4% |