Immigrants from Central America vs Cheyenne Self-Care Disability
COMPARE
Immigrants from Central America
Cheyenne
Self-Care Disability
Self-Care Disability Comparison
Immigrants from Central America
Cheyenne
2.6%
SELF-CARE DISABILITY
0.3/ 100
METRIC RATING
256th/ 347
METRIC RANK
2.6%
SELF-CARE DISABILITY
0.6/ 100
METRIC RATING
246th/ 347
METRIC RANK
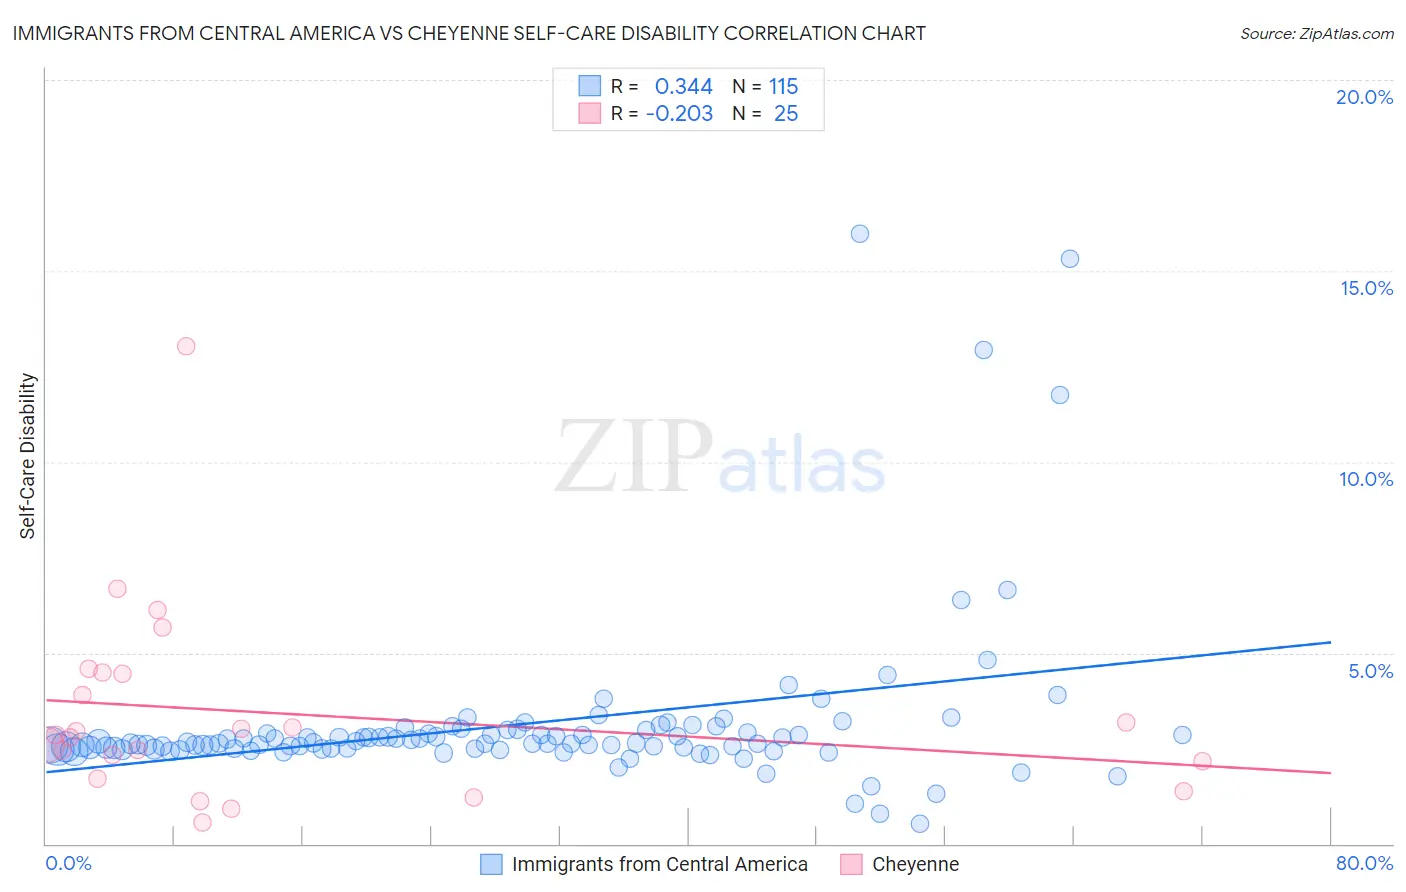
Immigrants from Central America vs Cheyenne Self-Care Disability Correlation Chart
The statistical analysis conducted on geographies consisting of 534,996,310 people shows a mild positive correlation between the proportion of Immigrants from Central America and percentage of population with self-care disability in the United States with a correlation coefficient (R) of 0.344 and weighted average of 2.6%. Similarly, the statistical analysis conducted on geographies consisting of 80,691,383 people shows a weak negative correlation between the proportion of Cheyenne and percentage of population with self-care disability in the United States with a correlation coefficient (R) of -0.203 and weighted average of 2.6%, a difference of 0.76%.
Self-Care Disability Correlation Summary
| Measurement | Immigrants from Central America | Cheyenne |
| Minimum | 0.52% | 0.57% |
| Maximum | 16.0% | 13.0% |
| Range | 15.5% | 12.5% |
| Mean | 3.1% | 3.4% |
| Median | 2.6% | 2.9% |
| Interquartile 25% (IQ1) | 2.5% | 1.9% |
| Interquartile 75% (IQ3) | 2.9% | 4.5% |
| Interquartile Range (IQR) | 0.43% | 2.5% |
| Standard Deviation (Sample) | 2.2% | 2.6% |
| Standard Deviation (Population) | 2.2% | 2.5% |
Demographics Similar to Immigrants from Central America and Cheyenne by Self-Care Disability
In terms of self-care disability, the demographic groups most similar to Immigrants from Central America are Tsimshian (2.6%, a difference of 0.020%), Haitian (2.6%, a difference of 0.060%), Immigrants from Haiti (2.6%, a difference of 0.080%), Immigrants from Bangladesh (2.6%, a difference of 0.16%), and Potawatomi (2.6%, a difference of 0.20%). Similarly, the demographic groups most similar to Cheyenne are Immigrants from Western Asia (2.6%, a difference of 0.020%), Immigrants from Albania (2.6%, a difference of 0.13%), Nicaraguan (2.6%, a difference of 0.13%), Yuman (2.6%, a difference of 0.21%), and Hawaiian (2.6%, a difference of 0.25%).
| Demographics | Rating | Rank | Self-Care Disability |
| Immigrants | Syria | 1.0 /100 | #241 | Tragic 2.6% |
| Spanish | 0.8 /100 | #242 | Tragic 2.6% |
| Hawaiians | 0.8 /100 | #243 | Tragic 2.6% |
| Yuman | 0.8 /100 | #244 | Tragic 2.6% |
| Immigrants | Western Asia | 0.6 /100 | #245 | Tragic 2.6% |
| Cheyenne | 0.6 /100 | #246 | Tragic 2.6% |
| Immigrants | Albania | 0.6 /100 | #247 | Tragic 2.6% |
| Nicaraguans | 0.6 /100 | #248 | Tragic 2.6% |
| Mexican American Indians | 0.5 /100 | #249 | Tragic 2.6% |
| Portuguese | 0.4 /100 | #250 | Tragic 2.6% |
| Immigrants | Liberia | 0.4 /100 | #251 | Tragic 2.6% |
| Immigrants | Bangladesh | 0.4 /100 | #252 | Tragic 2.6% |
| Immigrants | Haiti | 0.3 /100 | #253 | Tragic 2.6% |
| Haitians | 0.3 /100 | #254 | Tragic 2.6% |
| Tsimshian | 0.3 /100 | #255 | Tragic 2.6% |
| Immigrants | Central America | 0.3 /100 | #256 | Tragic 2.6% |
| Potawatomi | 0.3 /100 | #257 | Tragic 2.6% |
| Immigrants | Nonimmigrants | 0.3 /100 | #258 | Tragic 2.6% |
| Immigrants | Belarus | 0.2 /100 | #259 | Tragic 2.6% |
| Chippewa | 0.2 /100 | #260 | Tragic 2.6% |
| Arapaho | 0.2 /100 | #261 | Tragic 2.6% |