Immigrants from Burma/Myanmar vs Immigrants from Eastern Europe Self-Care Disability
COMPARE
Immigrants from Burma/Myanmar
Immigrants from Eastern Europe
Self-Care Disability
Self-Care Disability Comparison
Immigrants from Burma/Myanmar
Immigrants from Eastern Europe
2.5%
SELF-CARE DISABILITY
52.8/ 100
METRIC RATING
173rd/ 347
METRIC RANK
2.5%
SELF-CARE DISABILITY
28.0/ 100
METRIC RATING
189th/ 347
METRIC RANK
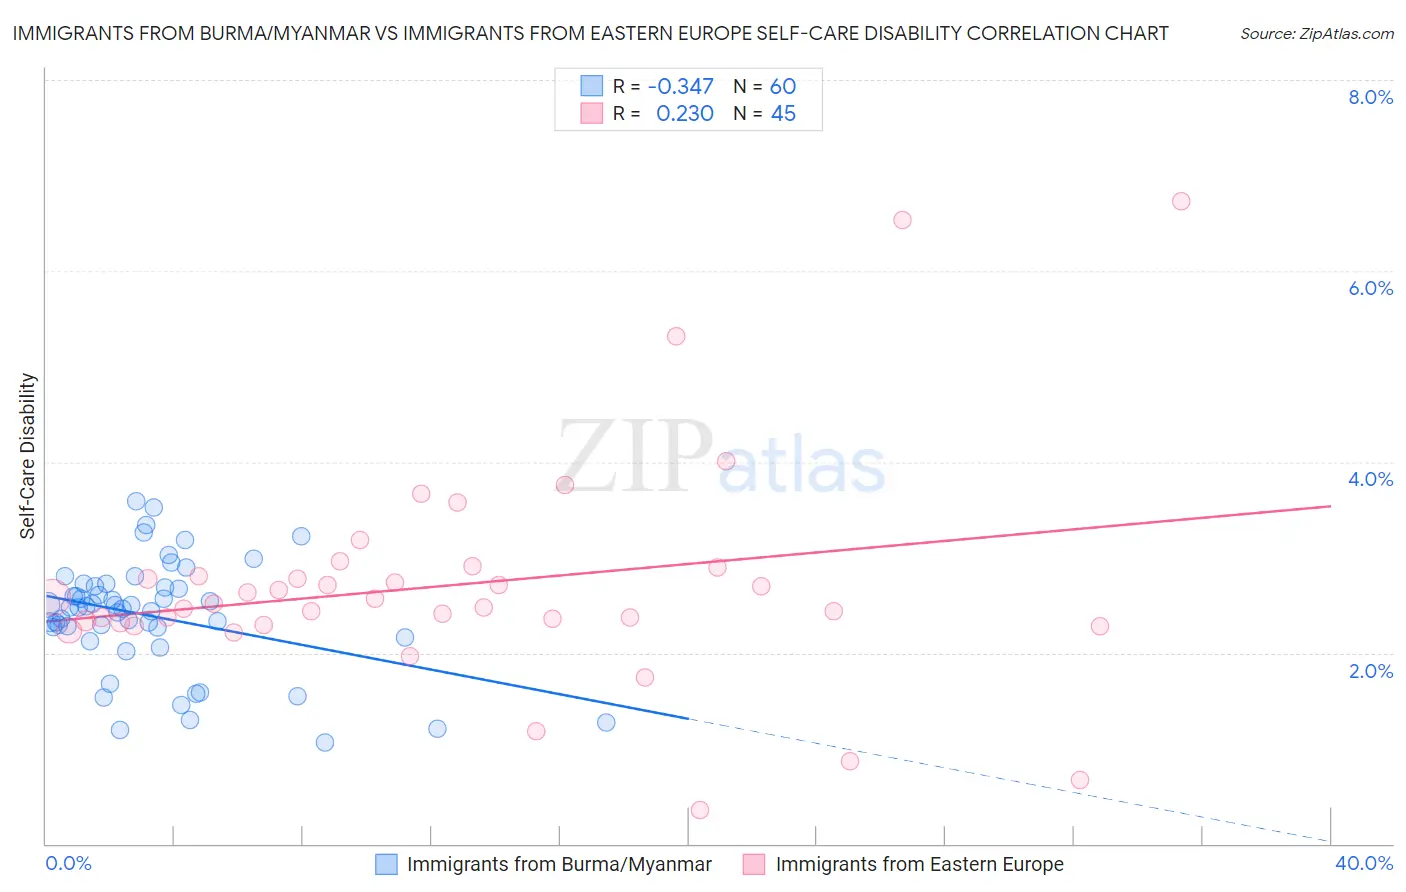
Immigrants from Burma/Myanmar vs Immigrants from Eastern Europe Self-Care Disability Correlation Chart
The statistical analysis conducted on geographies consisting of 172,240,034 people shows a mild negative correlation between the proportion of Immigrants from Burma/Myanmar and percentage of population with self-care disability in the United States with a correlation coefficient (R) of -0.347 and weighted average of 2.5%. Similarly, the statistical analysis conducted on geographies consisting of 474,965,919 people shows a weak positive correlation between the proportion of Immigrants from Eastern Europe and percentage of population with self-care disability in the United States with a correlation coefficient (R) of 0.230 and weighted average of 2.5%, a difference of 1.3%.
Self-Care Disability Correlation Summary
| Measurement | Immigrants from Burma/Myanmar | Immigrants from Eastern Europe |
| Minimum | 1.1% | 0.35% |
| Maximum | 3.6% | 6.7% |
| Range | 2.5% | 6.4% |
| Mean | 2.4% | 2.7% |
| Median | 2.5% | 2.5% |
| Interquartile 25% (IQ1) | 2.2% | 2.3% |
| Interquartile 75% (IQ3) | 2.7% | 2.8% |
| Interquartile Range (IQR) | 0.48% | 0.54% |
| Standard Deviation (Sample) | 0.58% | 1.2% |
| Standard Deviation (Population) | 0.57% | 1.2% |
Demographics Similar to Immigrants from Burma/Myanmar and Immigrants from Eastern Europe by Self-Care Disability
In terms of self-care disability, the demographic groups most similar to Immigrants from Burma/Myanmar are Pennsylvania German (2.5%, a difference of 0.030%), Czechoslovakian (2.5%, a difference of 0.030%), Welsh (2.5%, a difference of 0.13%), Immigrants from Bosnia and Herzegovina (2.5%, a difference of 0.15%), and Immigrants from Afghanistan (2.5%, a difference of 0.25%). Similarly, the demographic groups most similar to Immigrants from Eastern Europe are Immigrants from Oceania (2.5%, a difference of 0.010%), Irish (2.5%, a difference of 0.040%), Sioux (2.5%, a difference of 0.21%), Immigrants from El Salvador (2.5%, a difference of 0.28%), and Moroccan (2.5%, a difference of 0.32%).
| Demographics | Rating | Rank | Self-Care Disability |
| Pennsylvania Germans | 53.5 /100 | #171 | Average 2.5% |
| Czechoslovakians | 53.5 /100 | #172 | Average 2.5% |
| Immigrants | Burma/Myanmar | 52.8 /100 | #173 | Average 2.5% |
| Welsh | 50.0 /100 | #174 | Average 2.5% |
| Immigrants | Bosnia and Herzegovina | 49.6 /100 | #175 | Average 2.5% |
| Immigrants | Afghanistan | 47.6 /100 | #176 | Average 2.5% |
| Immigrants | Kazakhstan | 46.7 /100 | #177 | Average 2.5% |
| English | 46.2 /100 | #178 | Average 2.5% |
| Hungarians | 45.5 /100 | #179 | Average 2.5% |
| Indonesians | 41.2 /100 | #180 | Average 2.5% |
| Ghanaians | 40.4 /100 | #181 | Average 2.5% |
| Maltese | 37.5 /100 | #182 | Fair 2.5% |
| Salvadorans | 36.4 /100 | #183 | Fair 2.5% |
| Yugoslavians | 36.1 /100 | #184 | Fair 2.5% |
| Slavs | 34.3 /100 | #185 | Fair 2.5% |
| Immigrants | El Salvador | 33.0 /100 | #186 | Fair 2.5% |
| Irish | 28.7 /100 | #187 | Fair 2.5% |
| Immigrants | Oceania | 28.3 /100 | #188 | Fair 2.5% |
| Immigrants | Eastern Europe | 28.0 /100 | #189 | Fair 2.5% |
| Sioux | 24.6 /100 | #190 | Fair 2.5% |
| Moroccans | 22.9 /100 | #191 | Fair 2.5% |