Immigrants from Cabo Verde vs Afghan Self-Care Disability
COMPARE
Immigrants from Cabo Verde
Afghan
Self-Care Disability
Self-Care Disability Comparison
Immigrants from Cabo Verde
Afghans
3.1%
SELF-CARE DISABILITY
0.0/ 100
METRIC RATING
340th/ 347
METRIC RANK
2.4%
SELF-CARE DISABILITY
82.3/ 100
METRIC RATING
143rd/ 347
METRIC RANK
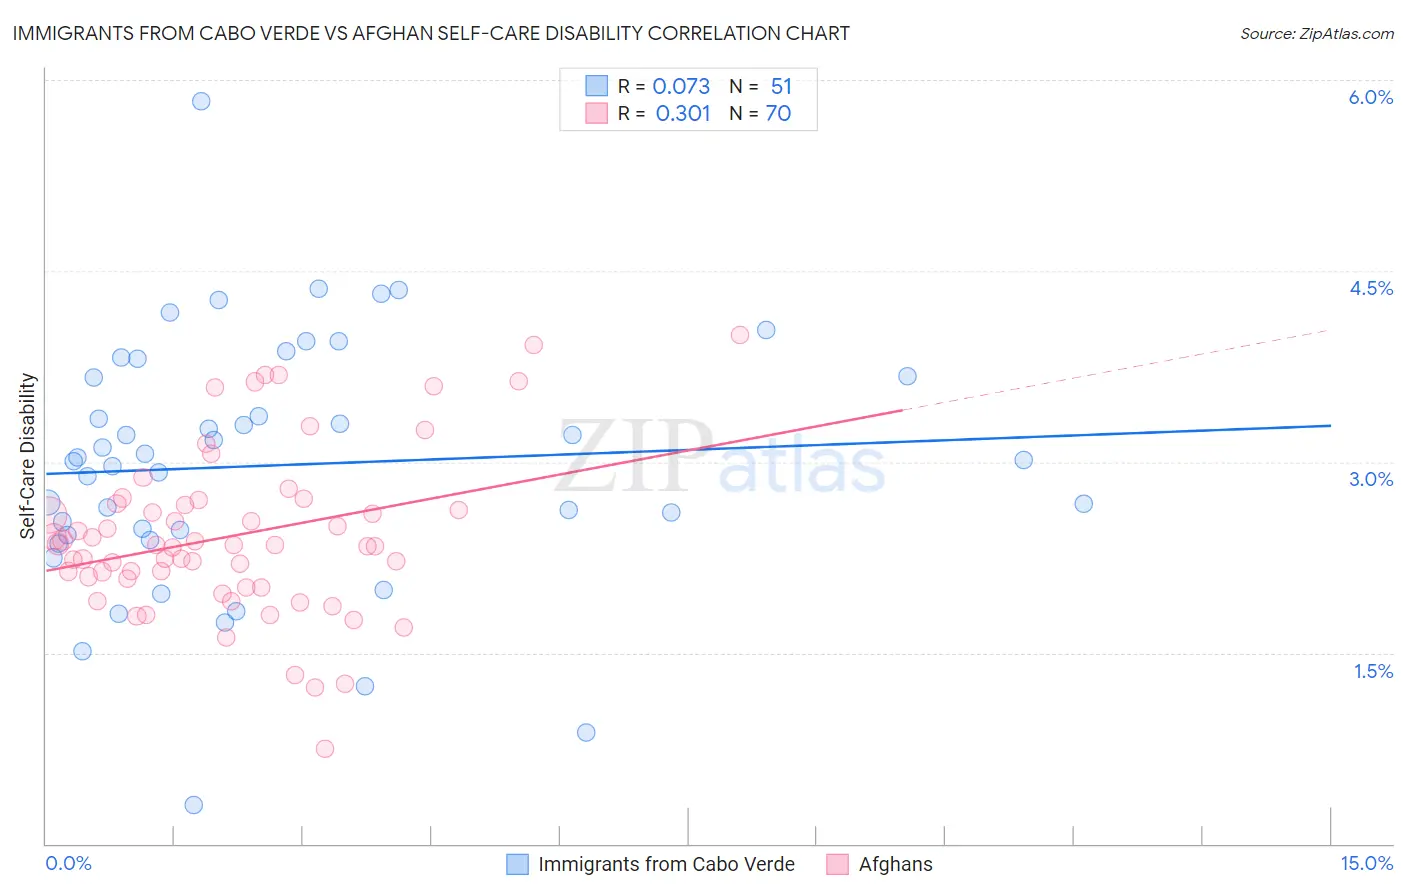
Immigrants from Cabo Verde vs Afghan Self-Care Disability Correlation Chart
The statistical analysis conducted on geographies consisting of 38,125,014 people shows a slight positive correlation between the proportion of Immigrants from Cabo Verde and percentage of population with self-care disability in the United States with a correlation coefficient (R) of 0.073 and weighted average of 3.1%. Similarly, the statistical analysis conducted on geographies consisting of 148,790,776 people shows a mild positive correlation between the proportion of Afghans and percentage of population with self-care disability in the United States with a correlation coefficient (R) of 0.301 and weighted average of 2.4%, a difference of 26.2%.
Self-Care Disability Correlation Summary
| Measurement | Immigrants from Cabo Verde | Afghan |
| Minimum | 0.30% | 0.74% |
| Maximum | 5.8% | 4.0% |
| Range | 5.5% | 3.3% |
| Mean | 3.0% | 2.4% |
| Median | 3.0% | 2.3% |
| Interquartile 25% (IQ1) | 2.4% | 2.1% |
| Interquartile 75% (IQ3) | 3.7% | 2.7% |
| Interquartile Range (IQR) | 1.2% | 0.59% |
| Standard Deviation (Sample) | 1.00% | 0.65% |
| Standard Deviation (Population) | 0.99% | 0.64% |
Similar Demographics by Self-Care Disability
Demographics Similar to Immigrants from Cabo Verde by Self-Care Disability
In terms of self-care disability, the demographic groups most similar to Immigrants from Cabo Verde are Dominican (3.1%, a difference of 0.26%), Immigrants from Dominican Republic (3.0%, a difference of 0.33%), Cape Verdean (3.0%, a difference of 0.72%), Choctaw (3.0%, a difference of 1.0%), and Colville (3.1%, a difference of 1.9%).
| Demographics | Rating | Rank | Self-Care Disability |
| Dutch West Indians | 0.0 /100 | #333 | Tragic 3.0% |
| Houma | 0.0 /100 | #334 | Tragic 3.0% |
| Immigrants | Azores | 0.0 /100 | #335 | Tragic 3.0% |
| Immigrants | Yemen | 0.0 /100 | #336 | Tragic 3.0% |
| Choctaw | 0.0 /100 | #337 | Tragic 3.0% |
| Cape Verdeans | 0.0 /100 | #338 | Tragic 3.0% |
| Immigrants | Dominican Republic | 0.0 /100 | #339 | Tragic 3.0% |
| Immigrants | Cabo Verde | 0.0 /100 | #340 | Tragic 3.1% |
| Dominicans | 0.0 /100 | #341 | Tragic 3.1% |
| Colville | 0.0 /100 | #342 | Tragic 3.1% |
| Tohono O'odham | 0.0 /100 | #343 | Tragic 3.1% |
| Pueblo | 0.0 /100 | #344 | Tragic 3.3% |
| Armenians | 0.0 /100 | #345 | Tragic 3.4% |
| Puerto Ricans | 0.0 /100 | #346 | Tragic 3.7% |
| Immigrants | Armenia | 0.0 /100 | #347 | Tragic 4.2% |
Demographics Similar to Afghans by Self-Care Disability
In terms of self-care disability, the demographic groups most similar to Afghans are Immigrants from Peru (2.4%, a difference of 0.080%), Costa Rican (2.4%, a difference of 0.12%), German (2.4%, a difference of 0.17%), Israeli (2.4%, a difference of 0.18%), and Alaska Native (2.4%, a difference of 0.19%).
| Demographics | Rating | Rank | Self-Care Disability |
| South American Indians | 87.2 /100 | #136 | Excellent 2.4% |
| Austrians | 87.0 /100 | #137 | Excellent 2.4% |
| Immigrants | Croatia | 86.6 /100 | #138 | Excellent 2.4% |
| Sri Lankans | 86.6 /100 | #139 | Excellent 2.4% |
| Immigrants | Uruguay | 85.4 /100 | #140 | Excellent 2.4% |
| Alaska Natives | 84.5 /100 | #141 | Excellent 2.4% |
| Immigrants | Peru | 83.2 /100 | #142 | Excellent 2.4% |
| Afghans | 82.3 /100 | #143 | Excellent 2.4% |
| Costa Ricans | 80.8 /100 | #144 | Excellent 2.4% |
| Germans | 80.1 /100 | #145 | Excellent 2.4% |
| Israelis | 80.0 /100 | #146 | Good 2.4% |
| Dutch | 77.5 /100 | #147 | Good 2.4% |
| Romanians | 75.8 /100 | #148 | Good 2.4% |
| Arabs | 75.7 /100 | #149 | Good 2.4% |
| Immigrants | Costa Rica | 75.1 /100 | #150 | Good 2.4% |