Immigrants from Central America vs Afghan Male Poverty
COMPARE
Immigrants from Central America
Afghan
Male Poverty
Male Poverty Comparison
Immigrants from Central America
Afghans
13.9%
MALE POVERTY
0.0/ 100
METRIC RATING
295th/ 347
METRIC RANK
10.9%
MALE POVERTY
71.9/ 100
METRIC RATING
143rd/ 347
METRIC RANK
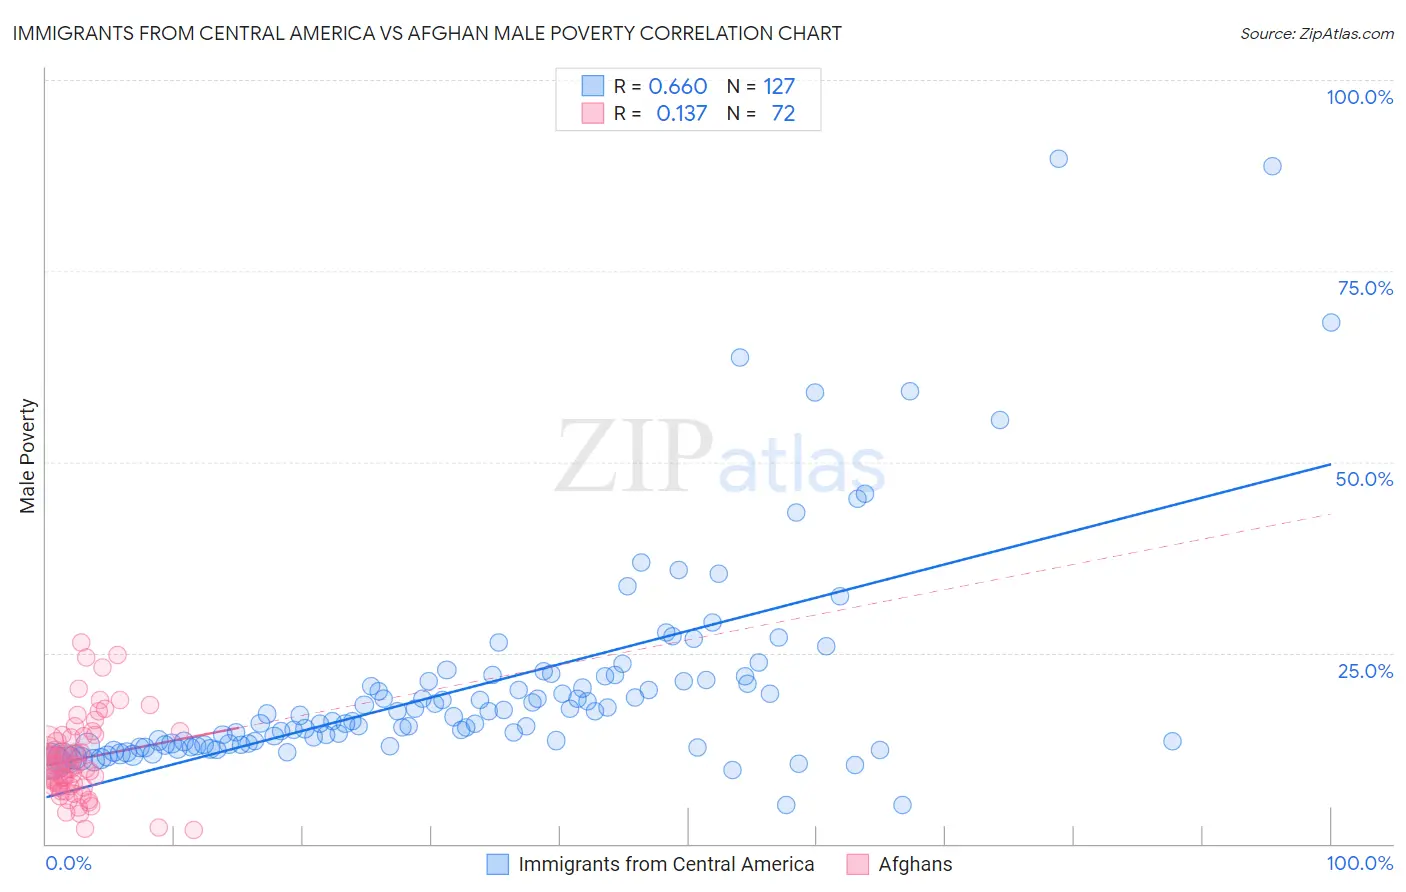
Immigrants from Central America vs Afghan Male Poverty Correlation Chart
The statistical analysis conducted on geographies consisting of 535,621,488 people shows a significant positive correlation between the proportion of Immigrants from Central America and poverty level among males in the United States with a correlation coefficient (R) of 0.660 and weighted average of 13.9%. Similarly, the statistical analysis conducted on geographies consisting of 148,780,421 people shows a poor positive correlation between the proportion of Afghans and poverty level among males in the United States with a correlation coefficient (R) of 0.137 and weighted average of 10.9%, a difference of 27.1%.
Male Poverty Correlation Summary
| Measurement | Immigrants from Central America | Afghan |
| Minimum | 5.0% | 1.7% |
| Maximum | 89.7% | 26.4% |
| Range | 84.7% | 24.7% |
| Mean | 20.6% | 11.1% |
| Median | 16.1% | 10.4% |
| Interquartile 25% (IQ1) | 12.9% | 7.6% |
| Interquartile 75% (IQ3) | 21.5% | 14.0% |
| Interquartile Range (IQR) | 8.5% | 6.4% |
| Standard Deviation (Sample) | 14.1% | 5.3% |
| Standard Deviation (Population) | 14.0% | 5.3% |
Similar Demographics by Male Poverty
Demographics Similar to Immigrants from Central America by Male Poverty
In terms of male poverty, the demographic groups most similar to Immigrants from Central America are Cajun (13.9%, a difference of 0.11%), Hispanic or Latino (13.9%, a difference of 0.28%), Immigrants from Belize (13.8%, a difference of 0.34%), Indonesian (13.8%, a difference of 0.35%), and Vietnamese (13.8%, a difference of 0.52%).
| Demographics | Rating | Rank | Male Poverty |
| Immigrants | St. Vincent and the Grenadines | 0.0 /100 | #288 | Tragic 13.8% |
| Guatemalans | 0.0 /100 | #289 | Tragic 13.8% |
| Immigrants | Zaire | 0.0 /100 | #290 | Tragic 13.8% |
| Vietnamese | 0.0 /100 | #291 | Tragic 13.8% |
| Indonesians | 0.0 /100 | #292 | Tragic 13.8% |
| Immigrants | Belize | 0.0 /100 | #293 | Tragic 13.8% |
| Hispanics or Latinos | 0.0 /100 | #294 | Tragic 13.9% |
| Immigrants | Central America | 0.0 /100 | #295 | Tragic 13.9% |
| Cajuns | 0.0 /100 | #296 | Tragic 13.9% |
| Inupiat | 0.0 /100 | #297 | Tragic 14.0% |
| Blackfeet | 0.0 /100 | #298 | Tragic 14.0% |
| Immigrants | Guatemala | 0.0 /100 | #299 | Tragic 14.0% |
| Immigrants | Mexico | 0.0 /100 | #300 | Tragic 14.0% |
| Immigrants | Senegal | 0.0 /100 | #301 | Tragic 14.0% |
| Immigrants | Caribbean | 0.0 /100 | #302 | Tragic 14.0% |
Demographics Similar to Afghans by Male Poverty
In terms of male poverty, the demographic groups most similar to Afghans are Samoan (10.9%, a difference of 0.020%), Immigrants from Germany (10.9%, a difference of 0.040%), Syrian (10.9%, a difference of 0.070%), Basque (10.9%, a difference of 0.34%), and Icelander (11.0%, a difference of 0.41%).
| Demographics | Rating | Rank | Male Poverty |
| Immigrants | Israel | 80.9 /100 | #136 | Excellent 10.8% |
| Immigrants | Switzerland | 79.2 /100 | #137 | Good 10.8% |
| Yugoslavians | 78.2 /100 | #138 | Good 10.8% |
| Immigrants | Jordan | 77.5 /100 | #139 | Good 10.8% |
| Tlingit-Haida | 76.1 /100 | #140 | Good 10.9% |
| Immigrants | France | 75.8 /100 | #141 | Good 10.9% |
| Basques | 74.6 /100 | #142 | Good 10.9% |
| Afghans | 71.9 /100 | #143 | Good 10.9% |
| Samoans | 71.8 /100 | #144 | Good 10.9% |
| Immigrants | Germany | 71.6 /100 | #145 | Good 10.9% |
| Syrians | 71.4 /100 | #146 | Good 10.9% |
| Icelanders | 68.5 /100 | #147 | Good 11.0% |
| Armenians | 68.0 /100 | #148 | Good 11.0% |
| Immigrants | Venezuela | 67.9 /100 | #149 | Good 11.0% |
| Guamanians/Chamorros | 67.6 /100 | #150 | Good 11.0% |