Chinese vs Afghan Self-Care Disability
COMPARE
Chinese
Afghan
Self-Care Disability
Self-Care Disability Comparison
Chinese
Afghans
2.6%
SELF-CARE DISABILITY
2.9/ 100
METRIC RATING
226th/ 347
METRIC RANK
2.4%
SELF-CARE DISABILITY
82.3/ 100
METRIC RATING
143rd/ 347
METRIC RANK
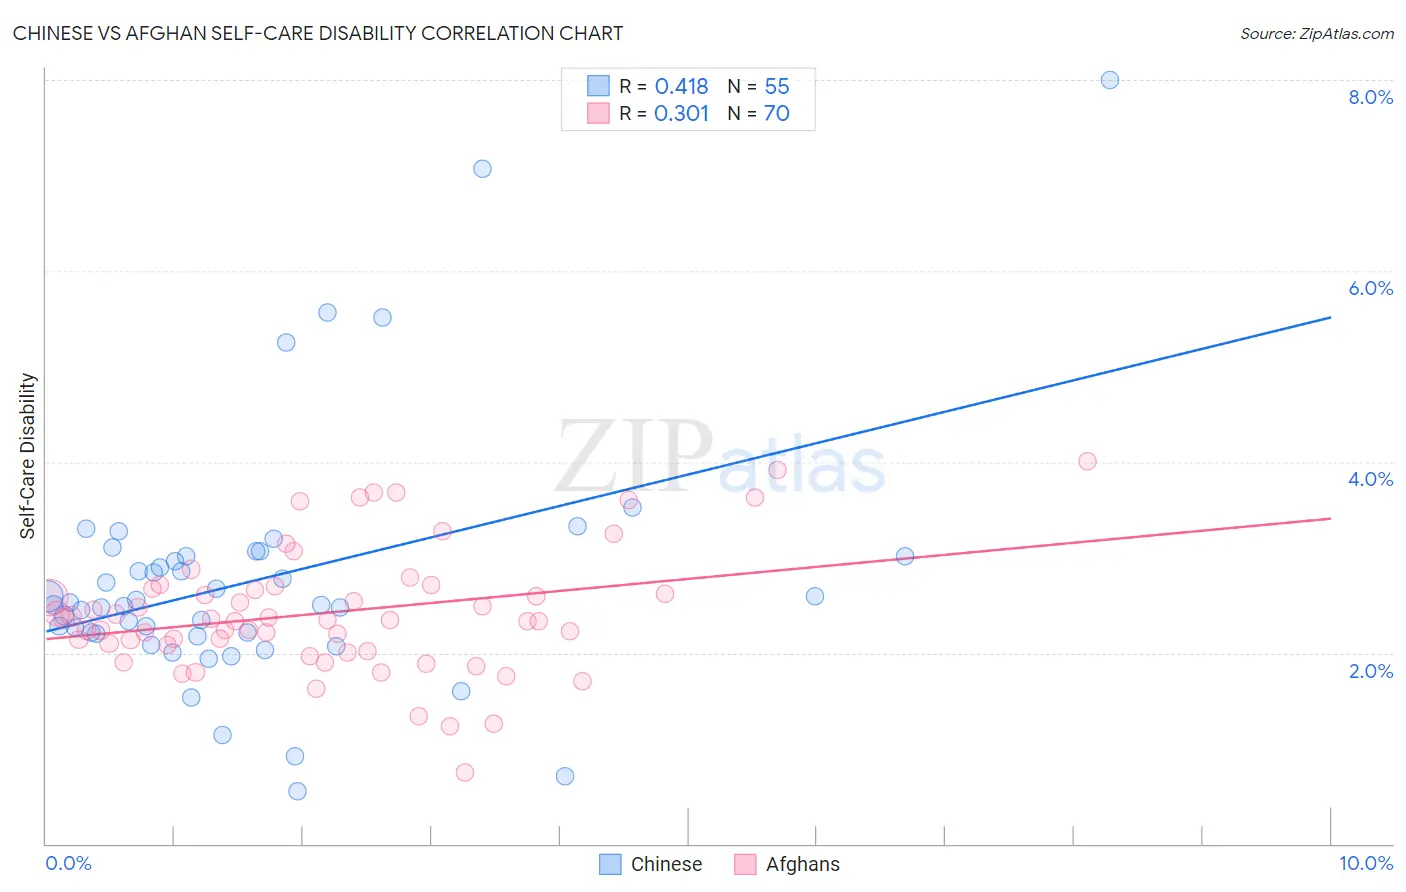
Chinese vs Afghan Self-Care Disability Correlation Chart
The statistical analysis conducted on geographies consisting of 64,799,357 people shows a moderate positive correlation between the proportion of Chinese and percentage of population with self-care disability in the United States with a correlation coefficient (R) of 0.418 and weighted average of 2.6%. Similarly, the statistical analysis conducted on geographies consisting of 148,790,776 people shows a mild positive correlation between the proportion of Afghans and percentage of population with self-care disability in the United States with a correlation coefficient (R) of 0.301 and weighted average of 2.4%, a difference of 6.1%.
Self-Care Disability Correlation Summary
| Measurement | Chinese | Afghan |
| Minimum | 0.55% | 0.74% |
| Maximum | 8.0% | 4.0% |
| Range | 7.4% | 3.3% |
| Mean | 2.8% | 2.4% |
| Median | 2.5% | 2.3% |
| Interquartile 25% (IQ1) | 2.2% | 2.1% |
| Interquartile 75% (IQ3) | 3.0% | 2.7% |
| Interquartile Range (IQR) | 0.82% | 0.59% |
| Standard Deviation (Sample) | 1.3% | 0.65% |
| Standard Deviation (Population) | 1.3% | 0.64% |
Similar Demographics by Self-Care Disability
Demographics Similar to Chinese by Self-Care Disability
In terms of self-care disability, the demographic groups most similar to Chinese are Immigrants from Philippines (2.6%, a difference of 0.080%), Guatemalan (2.6%, a difference of 0.090%), Iraqi (2.6%, a difference of 0.10%), Guamanian/Chamorro (2.6%, a difference of 0.16%), and Immigrants from Ecuador (2.6%, a difference of 0.16%).
| Demographics | Rating | Rank | Self-Care Disability |
| Immigrants | Moldova | 4.0 /100 | #219 | Tragic 2.6% |
| Sub-Saharan Africans | 4.0 /100 | #220 | Tragic 2.6% |
| Hondurans | 3.8 /100 | #221 | Tragic 2.6% |
| Spaniards | 3.8 /100 | #222 | Tragic 2.6% |
| French Canadians | 3.8 /100 | #223 | Tragic 2.6% |
| Osage | 3.6 /100 | #224 | Tragic 2.6% |
| Iraqis | 3.2 /100 | #225 | Tragic 2.6% |
| Chinese | 2.9 /100 | #226 | Tragic 2.6% |
| Immigrants | Philippines | 2.7 /100 | #227 | Tragic 2.6% |
| Guatemalans | 2.7 /100 | #228 | Tragic 2.6% |
| Guamanians/Chamorros | 2.5 /100 | #229 | Tragic 2.6% |
| Immigrants | Ecuador | 2.5 /100 | #230 | Tragic 2.6% |
| Immigrants | Guatemala | 2.2 /100 | #231 | Tragic 2.6% |
| Albanians | 2.2 /100 | #232 | Tragic 2.6% |
| Liberians | 2.1 /100 | #233 | Tragic 2.6% |
Demographics Similar to Afghans by Self-Care Disability
In terms of self-care disability, the demographic groups most similar to Afghans are Immigrants from Peru (2.4%, a difference of 0.080%), Costa Rican (2.4%, a difference of 0.12%), German (2.4%, a difference of 0.17%), Israeli (2.4%, a difference of 0.18%), and Alaska Native (2.4%, a difference of 0.19%).
| Demographics | Rating | Rank | Self-Care Disability |
| South American Indians | 87.2 /100 | #136 | Excellent 2.4% |
| Austrians | 87.0 /100 | #137 | Excellent 2.4% |
| Immigrants | Croatia | 86.6 /100 | #138 | Excellent 2.4% |
| Sri Lankans | 86.6 /100 | #139 | Excellent 2.4% |
| Immigrants | Uruguay | 85.4 /100 | #140 | Excellent 2.4% |
| Alaska Natives | 84.5 /100 | #141 | Excellent 2.4% |
| Immigrants | Peru | 83.2 /100 | #142 | Excellent 2.4% |
| Afghans | 82.3 /100 | #143 | Excellent 2.4% |
| Costa Ricans | 80.8 /100 | #144 | Excellent 2.4% |
| Germans | 80.1 /100 | #145 | Excellent 2.4% |
| Israelis | 80.0 /100 | #146 | Good 2.4% |
| Dutch | 77.5 /100 | #147 | Good 2.4% |
| Romanians | 75.8 /100 | #148 | Good 2.4% |
| Arabs | 75.7 /100 | #149 | Good 2.4% |
| Immigrants | Costa Rica | 75.1 /100 | #150 | Good 2.4% |